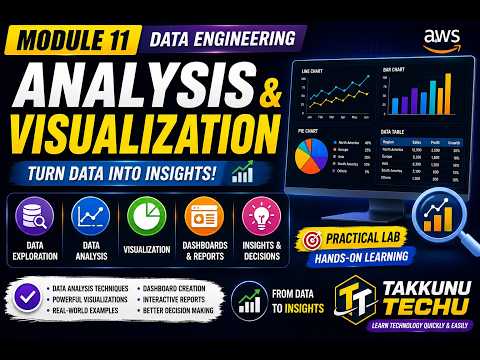
In the fast-paced world of Engineering IT, data is the most valuable asset an organization possesses. However, raw data by itself is like unrefined oil—it holds immense potential but requires sophisticated processing before it can provide any real value. This is where the intersection of data engineering and visualization becomes critical. In this guide, inspired by our deep dive into AWS Data Engineering, we explore how professionals transform chaotic datasets into clear, actionable narratives.
The Foundation: Beyond Simple Data Storage
Modern data engineering is about more than just moving files from one folder to another. It involves building robust pipelines that ensure data is clean, structured, and ready for analysis. For those pursuing a career in Engineering IT, understanding the "Transform" part of the ETL (Extract, Transform, Load) process is essential. By utilizing cloud environments like AWS, engineers can scale their processing power to handle massive datasets, ensuring that the information reaching the end-user is both accurate and timely.
Turning Complexity into Clarity
Visualization is the bridge between technical data architecture and business intelligence. While a data engineer might spend hours optimizing SQL queries or managing S3 buckets, the final output is usually a dashboard or a chart. Effective visualization allows stakeholders to spot trends, identify outliers, and make data-driven decisions at a glance.
Key tools in the AWS ecosystem, such as Amazon QuickSight, allow teams to create interactive dashboards that update in real-time. By mastering these tools, professionals specializing in Engineering IT are often the bridge between raw server logs and executive decisions, making them indispensable to their organizations.
Why Visualization is a Must-Have Skill
As we conclude our look into Module 11 of our data series, the takeaway is clear: analysis and visualization are the final "miles" of the data journey. Without them, the most advanced data pipeline in the world remains invisible to the people who need it most.
Whether you are building complex schemas or designing intuitive heat maps, the goal remains the same: to tell a story with data. By integrating these analytical skills into your technical repertoire, you position yourself at the forefront of the digital transformation era, ready to solve the complex challenges of the modern tech landscape.


