Canon to Commercialize 35MP/60fps and 120MP DSLRs

...
Canon announces that it is developing a Cinema EOS System 8K camera and a still-image 120MP DSLR camera.

The Cinema EOS System 8K camera being developed will be equipped with a Canon Super 35 mm-equivalent CMOS sensor with 8,192 x 4,320 pixel (approximately 35.39 million effective pixels) resolution, and a full resolution frame rate of 60fps with 13 stops of DR.

Another product in development is a DSLR camera featuring a resolution of approximately 120 effective megapixels, that "will incorporate a Canon-developed high-pixel-density CMOS sensor within the current EOS-series platform."
1:06 PM

Apple Announces Buried CFA and DTI in its New iPhone 6S and 6S Plus Image Sensors

...
Imaging Resource reports that a 12MP image sensor inside iSight cameras on the new iPhone 6S and 6S Plus feature two new technologies:

"The first of these is the decision to move the color filter that normally sits above the sensor directly onto top of the pixels, leaving less room for error. The second technology is the use of what Apple calls ‘Deep Trench Isolation’, which puts small dividers between the pixels to prevent light from bouncing around unnecessarily."


A Youtube video from today's Apple event shows the camera part of the presentation, starting from time 1:25:

12:25 PM

Beneath MN's Surface

...

 Image credit: www.mustesielu.deviantart.com
     This week I read the article "Beneath MN's  Surface." I was surprised to learn that there were any deadly water amoeba as far north as Minnesota, because I had heard that they needed especially warm conditions to survive, like in Florida or Texas. While it can definitely be disturbing or depressing to read articles like this, it is still important to know about the things they describe, and sometimes so we can remedy them.

Video credit: www.youtube.com/watch?v=7pR7TNzJ_pA      
     One water parasite that Minnesota's waters may  be becoming more hospitable towards is deadly water amoeba, or Naegleria fowleri. The amoeba causes amebic meningoencephalitis, by basically  traveling up your nose and living in, eating, and infecting your brain. While I haven't yet learned about deadly water amoeba's effects on non-human organisms, it does change our environment by making us more wary of swimming in warm water. As far as what is creating a space for deadly water amoebas to show up in Minnesota, it is probably because of global warming, and the summer heat waves which increase the risk of contracting amebic meningoencephalitis.
                                                                                 

      Around August 31st, a mysterious oily red film appeared on the surface of Richfield Lake. It resembles no natural algae or plant product, and is currently unidentified. It's appearance was noted by many people living nearby, and one Brigit Johnson said "It was shiny and red. I just thought it looked scary." Initial tests by scientists did not identify the substance, and even now it has not been identified. Personally, from how it has been described, I have some ideas as to what it is. Since it is on the surface of the lake, it is probably lighter than water, and hydrophobic. My guess is that it's either some sort of discarded chemical substance or an oil-based paint or something similar, but it could always be taken to an analytic chemist to know for sure. The article does not suggest that it probably won't affect humans, because Richfield's drinking water does not come from the  lake. However, it still may affect some of the aquatic life in the lake. Hopefully, though, since it isn't a naturally produced substance, it should be a one-time occurrence.

     The importance of determining water quality is so that we can know how pure and good the water we are using to drink and swim in is, as well as the water we use for other things, like boating or sailing. As water-conscious citizens, I think all should be aware of the quality of water that is their community. If a source of water is compromised it could negatively affect the health of both humans (especially those who are less wealthy, because they may not be affording personal house filters or purified bottles water)and many other animals. Finally, one way I could advocate for clean water is by working with my family to buy less toxic products, knowing that some of it will end up in the groundwater.


Yole Reports CCM ASP Rise

...
Yole Developpement publishes few more details from its 2015 Camera Module Industry Report. This time, Yole highlights the CCM price increase: “This trend is a real surprise. Indeed, at Yole, we follow the electronic components market for the mobile phones industry for a long time and we know the strategic importance of price in this sector”, comments Pierre Cambou, Activity Leader at Yole.

This market demand is partly answered by the penetration of Auto Focus (AF) and the Optical Image Stabilization (OIS) application reaching US$ 5.5 billion in 2020, with 21% CAGR between 2015 and 2020. Such figure highlights the strategic importance of the AF & OIS applications in the mobile phones sector and the possible implication of those technologies in future sensing applications.

“There is a different market trajectory for the lens and sensor markets, which are now maturing at approximately 14% CAGR with the emergence of giant billion-dollar companies”, explain Yole’s analysts. CCM and auto-focus manufacturing markets, which are still very fragmented and growing at roughly 20% CAGR, should experience consolidation over the next five years.

Automotive camera module revenue reached US$1.2 billion in 2014, and growing at a CAGR of 36% should reach US$7.9 billion by 2020. This growth has mainly benefited the CCM industry’s second-tier players, but the response of market leaders will be worth watching.

Few more slides from Yole's Slideshare presentation:

11:09 AM

Image Sensor and Camera Technology Training Tour

...
Aphesa organizes an image sensor and camera technology training tour between October 2015 and November 2016. The training sessions are organized as three days per location and split over several courses, it is possible to subscribe for a single course, multiple courses or the full session.

The courses are introductory to mid-level, with some advanced topics, and are designed for engineers who are new to the field of imaging or non-engineering personnel who needs a more in-depth understanding of the technology. It is also a good refresher course for experienced engineers and a good introductory course for sales, marketing and support personnel. Each course is accompanied by a question and answer session and an open discussion session.

The course agenda:

– Monday, October 12th:
  • Introduction to imaging (light, light spectrum, light sources, scene, behavior of light, basic radiometry and photometry, lighting techniques, polarization, filters, optical basics, MTF, camera basics, color issues, multispectral and hyperspectral imaging, camera interfaces, photography and imaging terms, lens standards, camera interface standards)
  • Introduction to CMOS image sensors (photodiodes, pixels, arrays, readout circuits, ADC circuits, architectures, spatial and temporal noise sources and noise compensation, color filters, microlenses, dark current, defect pixels, ageing, temperature effects, image sensor design flow).
– Tuesday, October 13th:
  • Introduction to software based (mutliple exposure) high dynamic range imaging, including algorithms and artifacts
  • Specific CMOS image sensors for high dynamic range imaging, including control methods, pixel designs and artifacts
  • Introduction to 3D imaging
  • Introduction to the EMVA1288 standard
  • Introduction to high speed and real time imaging
– Wednesday, October 14th:
  • Introduction to image processing

The Training Tour path is:

  • October 2015 – Spa, Belgium – minimum of 4 attendees per course
  • Early December 2015 – Yokohama, Japan – minimum of 19 attendees per course
  • Late January 2016 – San Diego, CA – minimum of 10 attendees per course
  • Early February 2016 – San Francisco, CA (limited courses only as part of SPIE Photonics
  • West and IS&T Electronic Imaging, separate symposium registration required)
  • Early May 2016 – Boston, MA – minimum of 7 attendees per course
  • July 2016 – Seoul, South Korea – minimum of 11 attendees per course
  • November 2016 – Stuttgart, Germany – minimum of 8 attendees per course
10:57 AM

TI Presents ToF Camera Calculator

...
I've received TI announcement of a nice 3D ToF camera estimator tool: "TI aims to develop an ecosystem around 3D Time-of-Flight technology that enables many applications apart from the most obvious gesture recognition applications. 3D ToF systems require a lot of collateral support. Some of the obvious questions that comes to a system designer's mind are - How do I know if 3D ToF can solve my problem? What would be the power required to get 'r' mm resolution at 'D' distance at 'F' framerate? What kind of lens would be needed? How does sunlight affect the performance? Do I have sufficient dynamic range or I get saturation with objects at close distance? etc.
To answer all of these questions, TI now provides an internally developed simulation tool here - 3D ToF System Estimator Tool:
"

10:44 AM

Canon Presents 250MP Sensor with 1.5um Pixels

...
Canon develops an APS-H-size (approx. 29.2 x 20.2 mm) CMOS sensor with approximately 250MP (19,580 x 12,600 pixels), said to be the world's highest number of pixels for a CMOS sensor smaller than the size of a 35 mm full-frame sensor. The new sensor achieves a readout speed of 1.25 Giga-pixels per second and can capture a full resolution video at a speed of 5fps. For comparison, modern mobile sensors having 20MP resolution at 30fps frame rate achieve 0.6 Giga-pixel per second speed in a mobile phone form factor.

Canon is considering the application of this technology in specialized surveillance and crime prevention tools, ultra-high-resolution measuring instruments and other industrial equipment, and the field of visual expression.

TechOn publishes a high resolution picture of the new sensor:

Canon 250MP sensor

BBC publishes fairly critical report on Canon announcement.
11:05 AM

Stingray and the Swiss Cheese of Electronic Privacy

...

The main distinguishing characteristic of Swiss cheese is that it's got holes in it.  This image came to mind when I read a recent report about a cellphone tracking device colloquially known as Stingray.  These expensive, sophisticated devices are contributing to a pernicious double standard about electronic privacy.  Private citizens on the one hand, and local and state law enforcement authorities on the other hand, appear to be working under very different rules.

Ordinary U. S. citizens are forbidden to eavesdrop on private electronic communications over the airwaves.  Back in the days when cellphones transmitted easily received analog signals, this meant you could not buy scanners that covered cell-phone frequencies.  And wiretapping—connecting a listening device to a telephone wire—was something that only authorized law enforcement people could do.  Back then, even the cops first had to get a court to issue a warrant for a wiretap, which was limited as to time and the target of the wiretapping.  Just to make sure that these restrictions weren't overwhelmed by new technological developments, in 1986 Congress passed the Electronic Communications Privacy Act (ECPA), which extended restrictions on landline communications to the then-new wireless types.

Then there was 9/11 and a burst of foreign terrorism, and a need arose to track cellphones in foreign countries that were being used for nefarious purposes, like setting off improvised explosive devices.  In response to this demand, the Harris Corporation developed a clever system that has come to be called the Stingray.  In order to track and eavesdrop on a target cellphone, you set up the Stingray in the general vicinity of the target—a few dozen or hundred yards is probably sufficient.  When the target phone is activated, the Stingray pretends it's a real cellphone tower, sending out a "pilot" signal that is stronger than the genuine tower's pilot nearby, and capturing not only the target phone, but many others in the vicinity.  In its most sophisticated mode, the Stingray performs a real-time decryption of the encrypted cellphone data and relays the content of the phone call (or text message, or what have you) to the legitimate system, while making copies for the cops.  In this mode, any calls the target phone originates go through as usual.  Only, the law enforcement people using the Stingray can hear and read everything in the vicinity.

I can't refer you to an advertising brochure or an official website on the Stingray, because Harris cloaks the device in secrecy.  Any agency buying one has to sign a non-disclosure agreement in which they promise not to divulge any details about it.  Nevertheless, the technology has become quite popular among the better-heeled state and local law enforcement agencies that can afford up to a half-million-dollar price tag.  And it is by no means clear that the agencies get proper court authorization before using the Stingray.  So your phone call or text might be showing up on a police computer near you—without your knowledge, of course.

In recent months, considerable information has leaked out about the Stingray and how it is being used, and there's even a Wikipedia webpage devoted to the technology.  It was most recently in the news when Deputy U. S. Attorney General Sally Yates announced on Sept. 3 that Federal investigators will now have to obtain a judge's permission before using cellphone trackers.  As recently as six months ago, the Feds were arguing in court that no such permission was necessary.  So on the federal level at least, some measure of protection has been restored to electronic privacy.  However, the ruling does not apply to state and local jurisdictions, which can presumably still use the Stingray and similar devices with impunity.

This is only one of many situations in which technology has outrun the legal system's ability to adapt to it.  Despite the blanket prohibitions of the ECPA, state and local law enforcement agencies are apparently using Stingrays frequently with or without court approval, depending on what the patchwork legal context in the specific region will let them get by with.  Sometimes, use of the device is revealed only in a court case when defense attorneys start asking embarrassing questions.  In Tallahassee, Florida, the state prosecutor gave an armed-robbery suspect a reduced sentence rather than being forced to disclose details of how a cellphone was tracked to the criminal's house—by use of a Stingray, presumably.

It may be the case that most, if not all, uses of this technology are approved by courts, although in some cases judges have complained that they were not aware of what exactly it was they were approving.  In that case, we are in principle no worse off privacy-wise than we were under the old regime of wiretapping laws, in which a court order was required to allow the telephone company technicians to permit a wiretap. 

We actually have two sets of Swiss cheese here:  one is the public's Fourth Amendment protection against unreasonable searches and seizures, and the other is the Harris Corporation's attempts to keep its technology out of the public eye.  Any system that has a 4500-word article on Wikipedia about it is no longer secret in any meaningful sense.  But nobody can sit down and build one for themselves just from the information on Wikipedia, and as long as nobody steals a physical unit and tries to reverse-engineer it, Harris is probably safe from getting their prize cellphone-tracker knocked off. 

There are two conflicting stakes here:  one on the part of the general public not to have its private communications eavesdropped on at the whim of a local police force, and another on the part of Harris Corporation not to have their advanced and very profitable cellphone tracker either copied or rendered useless by equally sophisticated bad guys who figure out some way to foil the Stingray.  One easy way to foil it is simply not to carry a cellphone, but for most people nowadays, that's like telling them not to breathe.  For the forseeable future, anyway, many crimes will involve cellphones one way or another, and the Stingray will continue to be useful in tracking down criminals.

My metaphorical hat is off to Deputy Attorney General Yates, who has at least clarified the situation at the federal level so that Stingrays will be used only with the proper authorization—we hope.  Maybe the state and local agencies will now follow the Federal lead and be more circumspect about how they use the devices, at least until the next round of electronic spy-and-counterspy warfare comes to pass.

Sources:  The New York Times article "Justice Dept. To Require Warrants for Some Cellphone Tracking" appeared on Sept. 3, 2015 at http://www.nytimes.com/2015/09/04/us/politics/justice-dept-to-require-warrants-for-some-cellphone-tracking.html.  I also referred to an earlier New York Times article "A Police Gadget Tracks Phones—Shhh-It's a Secret" at http://www.nytimes.com/2015/03/16/business/a-police-gadget-tracks-phones-shhh-its-secret.html.  The Washington Post carried the article about the plea bargain in Florida at https://www.washingtonpost.com/world/national-security/secrecy-around-police-surveillance-equipment-proves-a-cases-undoing/2015/02/22/ce72308a-b7ac-11e4-aa05-1ce812b3fdd2_story.html, and I also referred to the Wikipedia articles "Stingray Phone Tracker" and "Telephone Tapping," and a How Stuff Works article on how wiretapping works at http://people.howstuffworks.com/wiretapping3.htm.

Arctic Sea Ice Collapse Threatens - Update 8

...
The image below, from Arctic-roos.org, shows Arctic sea ice extent up to September 6, 2015.
Editorial note: The dramatic drop in sea ice extent shown on the image below turns out to be an error. The website at Arctic-roos.org is being updated and will show the correct extent soon.
The image shows a recent drop in sea ice extent that is so dramatic (red line, i.e. extent for the year 2015) that some think that it must be a glitch in the system. Even so, it should act as a warning about deterioration of the sea ice in the Arctic.

As discussed in earlier posts, the sea ice today is in a terrible condition. Thick sea ice is virtually absent compared to the situation in the year 2012 around this time of year, as illustrated by the image below that compares sea ice thickness on September 5, 2012 (left panel) with September 5, 2015 (right panel).


Furthermore, sea surface temperatures are very high. The North Pacific, on September 3, 2015, was more than 1°C (1.8°F) warmer than it was compared to the period from 1971 to 2000, as illustrated by the Climate Reanalyzer image on the right.

Sea surface temperature are very high around North America, both in the Pacific Ocean and in the Atlantic Ocean. The image below shows sea surface temperatures on September 4, 2015, indicating that a huge amount of ocean heat has accumulated in the Atlantic Ocean off the coast of North America.

The Gulf Stream is pushing much of this warm water toward the Arctic Ocean. Additionally, warm water from the Pacific Ocean is entering the Arctic Ocean through the Bering Strait.


Above image below shows sea surface temperature anomalies in the Arctic as at September 6, 2015. 

As the Arctic warms up faster than the rest of the world, the jet stream becomes ever more destabilized, as illustrated by the image below. 


The image on the right, from the Naval Research Laboratory, shows sea ice speed and drift as forecast on September 5, 2015, for September 6, 2015. 

The situation looks set to get worse. Warm oceans increase the chance that strong winds will emerge that can have a devastating impact on the remaining sea ice in the Arctic.

As the September 7, 2015, image below right shows, cyclones are lining up in the Pacific Ocean, with their strongest impact yet to hit the Arctic Ocean. 

There still is some time to go before sea ice can be expected to reach its minimum, at around half September 2015, while sea currents will continue to carry warmer water into the Arctic Ocean for months to come.

There is a strengthening El Niño, while more open water increases the chance that storms will develop that will push the last remnants of the sea ice out of the Arctic Ocean, as discussed in earlier posts such as this one. Storms can also mix warm surface waters all the way down to the seafloor, as discussed in this earlier post. Cyclones increase this danger.

These cyclones are headed in the direction of the Arctic. The Climate Reanalyzer forecast for September 14, 2015, below shows strong winds over the Pacific Ocean close to the Arctic Ocean, as well as over the Arctic Ocean and the North Atlantic.


The situation is dire and calls for comprehensive and effective action, as discussed in the Climate Plan.


Sea surface temperature anomalies in the Arctic as at September 6, 2015. From 'Arctic Sea Ice Collapse Threatens -...
Posted by Sam Carana on Monday, September 7, 2015

Kinect-1 Team Wins Image Engineering Innovation Award

...
The Society for Imaging Science and Technology (IS&T) and Image Engineering GmbH & Co. KG announce that the 2015 Image Engineering Innovation Award (IEIA) is given to Javier Garcia-Monreal, Alex Kipman, Alexander Shpunt, and Zeev Zalevsky for the development of Breakthrough 3-D Sensing Technologies and Products. The award recognizes the innovation in 3-D image sensing developed by PrimeSense and Microsoft and incorporated in the Microsoft Kinect sensor for the Xbox 360 game console. This breakthrough enabled users to control games by gestures and actions.

“This award recognizes four talented innovators, from four different organizations, who pioneered the image depth acquisition hardware and software used in the Microsoft Kinect sensor,” says Ken Parulski, chair of the IEIA award committee. “Their creativity and teamwork enabled Kinect to become the first successful mass-market 3D camera, and the fastest-selling new consumer electronics product ever created.”

3-D images are sensed by an Infrared CMOS image sensor, which captures images of a speckle pattern created using a low-power IR laser and a diffraction grating. The reflected pattern is captured by the IR sensor and correlated with a reference pattern, to produce a depth map of the objects in the color video image.

The Kinect sensor sold 8 million units within the first 60 days of its introduction, making it the most successful 3-D camera. It uses depth sensing technology developed by Zeev Zalevsky at Bar Ilan University, Javier Garcia-Monreal at the University of Valencia, and Alexander Shpunt and his colleagues at PrimeSense in Israel, as well as gesture and face recognition software developed by Alex Kipman and his colleagues at Microsoft.
10:55 AM

Sony Sees Bright Future for 1,000fps Sensor

...
Bloomberg reports that Sony is "focusing on sensors that take photos at least 10 times faster than the human eye can see. The company is working with Nissan Motor Co. and a Tokyo University professor on affordable technology that can process 1,000 images a second.

<...>The high-speed sensors could help driverless cars avoid road hazards or allow industrial robots to speed up manufacturing. <...>Chips that capture 1,000 frames per second do exist, but their cost and size make them impractical for mass-market uses. For example, cameras with that kind of speed run $1,000 to $100,000 from companies including Sony and Vision Research Inc. The challenge is to shrink that power into a module small enough to fit in a car’s rear-view mirror and cheap enough for devices such as wearables. <...>the company has been able to achieve 900 frames per second with prototypes.

<...> “Until now, Sony has been very focused on designing image sensors that deliver beautiful photos,” said Shinichi Yoshimura, a Sony manager in charge of combining hardware and software for emerging technologies. “The images for sensing require a different kind of chip, and the challenge is converting technologies that make beautiful photos to new uses.”

“High-speed image sensors are a niche industry, but Sony has the power to take it mainstream,” [Masatoshi Ishikawa, University of Tokyo professor of engineering and robotics, said.] “And that may be just two years away.”

“As smartphone demand matures, at some point other Sony competitors will catch up in this technology,” said Yu Okazaki, an analyst at Nomura Securities Co. in Tokyo. “It is important to diversify applications to robots, cars, et cetera.” <...> the company expects its sales to climb as much as 62 percent to 1.5 trillion yen in three years."


SeekingAlpha quotes Sony CEO, Kaz Hirai, saying that the company "plans to invest €1.5B ($1.7B) in its image sensor ops in FY16 (ends March '16) - 5x what it invested in FY15."

A University of Tokyo spin-off Exvision, lead by Masatoshi Ishikawa, works on high speed image sensor applications:

7:52 AM

Methane Monster II ~ Demise of the Arctic

...


Presentation by Jennifer Hynes on runaway feedbacks in the Arctic and the resulting threat of near-term human extinction. At youtube.com/watch?t=309&v=L19JBY0kNmo


There are links to the transcript and to the complete set of slides of the presentation at Jennifer Hynes' blog.

In case you are looking for the earlier presentation by Jennifer Hynes, called 'The Arctic Methane Monster's Rapid Rise', it's at youtube.com/watch?v=a9PshoYtoxo and is also displayed below.


Methane Monster II ~ Demise of the Arctic by Jennifer Hynes http://arctic-news.blogspot.com/2015/09/methane-monster-2-demise-of-the-arctic.html
Posted by Sam Carana on Saturday, September 5, 2015

AR Startup Magic Leap Publishes 115 Patent Applications in 2 Weeks

...
re/code, Fortune: AR startup Magic Leap known by a high profile Google investment at a valuation of $2 billion, managed to publish 115 patent applications in just 2 weeks from Aug. 20 to Sept 3. None of these patents relates to image sensors, but Magic Leap's product uses cameras and gesture recognition quite extensively, as shown in the company's Youtube video:

11:05 AM

As 2015 smashes temperature records, it's hotter than you think

...

by David Spratt

Spanish version

There is an El Niño in full swing which helps push average global temperatures higher, and records are being broken, but just how hot is it? For several years, we have heard that global warming has pushed temperatures higher by around 0.8 to 0.85 degrees Celsius (°C).

But in 2015, that number is not even close.

Even before this year's strong El Niño developed, 2015 was a hot year. The first few months of the year broken records for the hottest corresponding period in previous years all the way back to the start of the instrumental record in 1880. Each month, new records fell.


With the July data in, NOAA, the US Government's National Oceanic and Atmospheric Administration, reported that July was the hottest month among the 1627 months on record since 1880, and the first seven months of the year was the hottest January-July on record:
The July average temperature across global land and ocean surfaces was 0.81°C above the 20th century average. As July is climatologically the warmest month for the year, this was also the all-time highest monthly temperature in the 1880-2015 record, at 16.61°C, surpassing the previous record set in 1998 by 0.08°C.

The July globally-averaged sea surface temperature was 0.75°C above the 20th century average. This was the highest temperature for any month in the 1880-2015 record, surpassing the previous record set in July 2014 by 0.07°C. The global value was driven by record warmth across large expanses of the Pacific and Indian Oceans.

The year-to-date temperature combined across global land and ocean surfaces was 0.85°C above the 20th century average. This was the highest for January-July in the 1880-2015 record, surpassing the previous record set in 2010 by 0.09°C.
In addition the year-to-date globally-averaged land surface temperature beat the previous record in 2007 by a whopping 0.15°C, and the year-to-date globally-averaged sea surface temperature surpassed the previous record of 2010 by 0.06°C. Every major ocean basin observed record warmth in some areas.

And, as Joe Romm has reported, "It was especially hot for the 6 billion of us up here in the northern hemisphere, where the first seven months of 2015 were a remarkable 0.3°F (0.17°C) warmer than the first seven months of any year on record — and nearly a half degree Fahrenheit warmer than any year before 2007".

El Niño may be strongest on record


So this year, records are not being broken. They are being smashed, as a strong El Niño (and perhaps the strongest on record) is set to persist through to 2016. El Niño conditions are characterised by a warm band of water across the eastern tropical Pacific Ocean and facilitate the transfer of heat from the ocean surface layer to the atmosphere and are associated with a hotter climate.

The NOAA's most recent El Niño update (Climate Prediction Center / NCEP 17 August 2015) reports that:
All multi-model averages suggest that El Niño 3.4 will be above +1.5ºC (a “strong” El Niño) during late 2015 into early 2016.
(El Niño 3.4 is the zone of longitudes 120 to 150W along the equatorial Pacific Ocean).


As the chart above illustrates, the projected strength of the El Niño (yellow line) is slightly above the previous strongest such event in 1997 (red dots).

So hot will 2015 be? The NOAA has already reported that the first seven months of the year was almost 0.1°C above the previous record. This is a huge amount in a field where changes are often measured in one-hundredths of a degree.

With a 90% chance of the El Niño persisting into 2016, it is as close as a certain bet can be that 2015 will be the hottest year on the instrumental record.

And there is probably an even-money chance that the margin will exceed 0.1°C. This would be an incredible result with scientists shocked at the margin by which records are being broken. Former NASA climate science chief James Hansen says:
We can already predict that the 2015 global temperature will exceed the prior warmest year (2014) by an unusually wide margin (~ 0.1°C), exceeding 1998 (“El Niño of the century”) even further.
And there is a good chance that 2016 will beat 2015 to become the hottest year on record.

It's hotter than you think

But much hotter has it got already? The convention is to talk about the amount of warming "above pre-industrial", that is, before the steam-and-coal industrial revolution, around 1750.

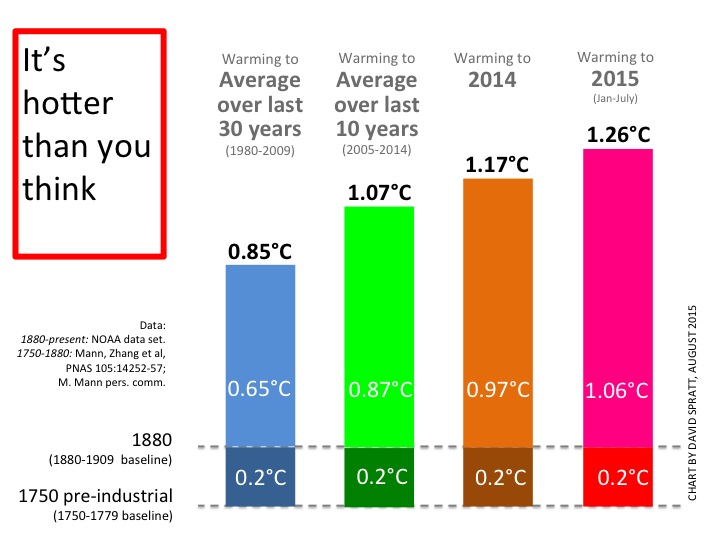
But the instrumental record used by the major agencies in the US, the UK and Japan does not start till 1880, and it is this period that is often used to provide a "pre-industrial" baseline. So when we hear that warming so far up to (the average of) the last decade as being 0.8°C or 0.85°C, it is the warming from a 1880 baseline (see light green column in figure below of 0.87°C, based on the NOAA dataset since 1880).

But the climate around 1750 and 1880 were not the same. Research using proxy data and modelling shows that between 1750 and 1880 the global average temperature increased by ~0.2°C.


 When that is added (dark green column), we find that the real warming from pre-industrial 1750 to the average of the last decade is 1.07°C. It is a shock to see that we are more than half way to the unsafe 2°C "guardrail" favoured by international policy-makers.

The warming over 1750 pre-industrial to 2014 was 1.17°C.

And for the first seven months of 2015, the margin is a staggering 1.26°C higher than the pre-industrial level. Yes, it is a strong El Niño period, and it may drop back for a short while, but 2016 could be just as hot and we may be entering a new phase of accelerated warming.

Greenhouse emissions continue to soar to record levels, and attempts to clean up and retire some of the world's dirtiest coal power plants may result in a lowering of the production of aerosols (including black-carbon soot, organic carbon, sulphates, nitrates, as well as dust from smoke, manufacturing and windstorms) which at the moment provide a temporary (~1 week) cooling of 0.8-1°C.

The leading climate researcher Michael E. Mann says that as fossil fuel use is curtailed, the aerosol cooling impact will lessen. Mann says that "if the world burns significantly less coal…we would have to limit CO2 to below roughly 405 ppm", a level we will reach in two years.

A climate emergency requiring levels of action far beyond anything that is currently perceived by policy makers? As temperatures soar to record levels and it is hotter than most people understand, you can bet on that.

Earlier posted at ClimateCodeRed.org


As 2015 smashes temperature records, it's hotter than you think | by David Spratt http://arctic-news.blogspot.com/2015/09/as-2015-smashes-temperature-records-its-hotter-than-you-think.html

Posted by Sam Carana on Thursday, September 3, 2015

SENSORS Journal Special Issue on Photon-Counting Image Sensors

...
IISS announces it is preparing a special issue of the journal SENSORS on Photon-Counting Image Sensors to be published in Spring 2016. The issue will contain all invited papers and all will be open-access. Invited authors (up to 20 due to budget) will not be charged any publication fee, open-access fee, or page charges for this special issue, which is sponsored by SENSORS and IISS. The Guest-Editor-in-Chief for the special issue is Eric Fossum (Dartmouth) with guest editors Albert Theuwissen (Delft and Harvest Imaging) and Nobu Teranishi (Univ. Hyogo and Shizuoka University). While there is already a list of potential invited speakers, there may be room for a few more and anyone wishing to be considered for an invited paper should contact Eric Fossum: fossum at imagesensors.org with a very brief proposal as soon as possible. Interest is in deep sub-electron read noise (less than 0 .5e-) devices and readout circuits, including low capacitance devices, devices with avalanche gain, multiple-sampling devices, low temperature devices, high energy photon counting devices as well as image formation algorithms and applications.

The IEEE Transactions on Electron Devices Special Issue on Solid-State Image Sensors (also coordinated by IISS, with Albert Theuwissen as Guest-Editor-in-Chief) is scheduled for publication in February 2016. Many of the 25+ IEEE TED SI papers are already available via early access on-line at IEEE Xplore, but only some are open-access.
12:40 PM

Gestigon Closes Third Financing Round

...
gestigon GmbH, a startup based in Lübeck, Germany, has announced that it closed a third financing round (Series A) in July 2015. The lead investor is nbr technology ventures GmbH, with additional investments from Vorwerk Direct Selling Ventures and High-Tech-Gründerfonds. According to CEO Moritz v. Grotthuss, the amount raised in this round was “several million” USD.

The company will use the funds to accelerate growth in its business, which is focused on licensing its gesture control and skeleton tracking middleware to key corporates in the automotive (where it has assumed global market leadership), consumer electronics, and augmented/virtual reality industries. It now has plans to expand into the rapidly growing field of augmented- and virtual reality solutions, including head mounted devices.
10:48 AM

ADAS Acronyms

...
As ADAS becomes a bigger and more important market for image sensor, Videantis publishes a list of ADAS-related acronyms helping you to navigate in the automotive world. Few examples of this new parlance showing how broad the car camera applications are:

  • ANV – Automotive Night Vision. Also known as Night View Assist.
  • APS – Automatic Parking System
  • BSD – Blind Spot Detection
  • BSM – Blind Spot Monitoring
  • BSW – Blind Spot Warning
  • BOP – Back-over Protection, Back-over Prevention
  • CIB – Crash Imminent Braking, Collision Imminent Braking
  • CDW – Collision Detection Warning
  • CAS – Collision Avoidance System
  • CMS – Camera Monitor System
  • CTA – Cross-Traffic Alert
  • DDW – Drowsy Driver Warning
  • DFW – Driver Fatigue Warning
  • DDD – Driver Drowsiness Detection
  • DMS – Driver Monitoring System
  • EDA – Emergency Driver Assistant
  • FCA – Forward Collision Avoidance
  • FCW – Forward Collision Warning
  • GFHB – Glare-free High Beam
  • HLA – Head Lamp Assist
  • ISA – Intelligent Speed Adaptation, Intelligent Speed Advice
  • LCA – Lane Change Assist, Lane Centering Assist
  • LD – Lane Detection
  • LDW – Lane Departure Warning
  • LKA – Lane Keeping Assist
  • RVC – Rear view camera
  • SVC – Surround View Camera
  • WWDA – Wrong-Way Driving Alert
  • WWDW – Wrong-Way Driving Warning

There are many more of them on Videantis site, accompanied by the nice explanations.
11:09 AM

Water Quality Indicators

...
Image credit: http://www.nihonsolid.co.jp

     This week I read an article about water quality indicators. The term communities is a good term to use when thinking about aquatic ecosystems because the organisms in the ecosystems depend on each other and the state of the water they live in to survive and thrive. One thing I learned more about was the effect of phosphates and nitrates on water, and how that directly affects the growth of water plants. I was slightly surprised to learn that many types of aquatic life prefer cooler water to warmer water.

     Temperature is one big indicator of water quality because it directly affects the amount of dissolved oxygen, or DO, in the water. Cooler water higher levels of DO, and warmer water has lower levels of DO. If temperature in the water increases, many of the aquatic organisms inhabiting it leave or die, because the water is too warm for them to thrive. Often, warm-water organisms will replace them. One big reason for temperature change like that is humans, and the many things we dump into lakes, rivers, and streams. Temperature changes caused by humans are called thermal pollution. Scientists and aquatic environmentalists can check for thermal pollution by testing the temperature of a river, lake, or stream at its source. Then, they move to a different point in the river, lake, or stream, and test the temperature again. If there is a big difference, then the water is probably thermally polluted. Generally, excellent quality water is 0-4 °F, and poor quality water is 18°F or greater.

     Another indicator of water quality is turbidity. Turbidity is basically the measure of how clear the water is. Turbid water has things like clay, silt, and bottom sediment suspended in it, which makes the water brownish or murky. Turbidity affects the quality of water because it affects the temperature of the water - suspended particles block and absorb sunlight. Then, of course, all of the effects of temperature start to occur. Turbidity levels are mainly affected by soil erosion, bottom sediment disturbance, and urban runoff.

     The last indicator of water quality I'm going to write about is plant growth. Algae and other water plants need a small amount of phosphates to grow. Too many phosphates or nitrates, however, increase the plant growth drastically. When there is too much algae, from increased amounts of phosphates and nitrates, it's called an algal bloom. The algal blooms are not good for the waterway, because they block sunlight from the roots of water plants, and when they decompose, the DO levels decrease. The main human sources of phosphates and nitrates in the water are fertilizer, laundry detergent, and sewage. The way to stop water quality decreasing from human-affected plant growth, is to be more effective about stopping phosphates and nitrates from entering the water. This can be done at farms, by building a barrier to stop large quantities of fertilized earth entering the water, and by watching were we dump our sewage.

     In class I have been studying water quality, and how fertilizer concentration affects the growth of duckweed. The article I read relates to my learning because knowing the indicators of water quality will help me understand other things about water quality. I would like to learn more about turbidity, and what natural levels of it are good for common aquatic life.


Arctic Sea Ice Collapse Threatens - Update 7

...
The image below shows Arctic sea ice extent, with the blue dot indicating that extent for August 30, 2015, was 4.804 million square kilometers. Satellite records shows that, at this time of the year, extent was only lower in 2007, 2011 and 2012.


There are a number of reasons why sea ice looks set to decrease dramatically over the next few weeks. On above image, extent for 2015 looks set to soon cross the lines for the years 2007 and 2011, while the sea ice today is in an even worse condition than one might conclude when looking at extent alone.

Thick sea ice is virtually absent compared to the situation in the year 2012 around this time of year, as illustrated by the image below that compares sea ice thickness on August 30, 2012 (left) with August 30, 2015 (right).


Furthermore, sea surface temperatures are very high. The North Pacific, on August 31, 2015, was about 1°C (1.8°F) warmer than it was compared to the period from 1971 to 2000, as illustrated by the Climate Reanalyzer image on the right.

As the image below shows, sea surface temperature anomalies are very high around North America, both in the Pacific Ocean and in the Atlantic Ocean.

The image below shows sea surface temperatures on August 30, 2015, indicating that a huge amount of ocean heat has accumulated in the Atlantic Ocean off the coast of North America.


The Gulf Stream is carrying much of this warm water toward the Arctic Ocean. Additionally, warm water from the Pacific Ocean is entering the Arctic Ocean through the Bering Strait.


Above image below shows sea surface temperature anomalies in the Arctic as at August 31, 2015.


There still are a few weeks to go before sea ice can be expected to reach its minimum, at around half September 2015, while sea currents will continue to carry warmer water into the Arctic Ocean for months to come.

There is a strengthening El Niño, while more open water increases the chance that storms will develop that will push the last remnants of the sea ice out of the Arctic Ocean, as discussed in earlier posts such as this one. Storms can also mix warm surface waters all the way down to the seafloor, as discussed in this earlier post. Typhoons increase this danger. The above image show three typhoons in the Pacific Ocean on 30 August, 2015, and the Climate Reanalyzer image on the right shows them on September 1, 2015.

These typhoons are headed in the direction of the Arctic. The Climate Reanalyzer forecast for September 8, 2015, below shows typhoons in the Pacific Ocean close to the Arctic Ocean, as well as strong wind over the Arctic Ocean.


The situation is dire and calls for comprehensive and effective action, as discussed in the Climate Plan.

Thick sea ice is virtually absent compared to the situation in the year 2012 around this time of year....
Posted by Sam Carana on Tuesday, September 1, 2015