DJI Phantom 4 Drone Features 5 Cameras

...
Drones quickly become a sizable camera market. The latest DJI Phantom 4 drone has 5 cameras (1 for remote viewing and recording plus 4 for vision processing: follow me, depth , object recognition and tracking, visual navigation). DJI is the world's largest drone manufacturer, based in Shenzhen, China.


Thanks to FS for the info!
12:24 PM

PDAF Pixel Report Update

...
Albert Theuwissen has updated his PDAF pixel characterization report with additional measurements focused on :
  • the influence of the exposure time on the PDAF pixel signals and the possibility to extract useful focusing information from it,
  • angular light dependency of the PDAF pixels.

The Harvest Imaging site look is also updated and is much nicer now.
12:12 PM

February Temperature

...

The February 2016 land and ocean temperature anomaly was 1.35°C (2.43°F) above the average temperature in the period from 1951 to 1980, as above image shows (Robinson projection).

On land, it was 1.68°C (3.02°F) warmer in February 2016, compared to 1951-1980, as the image below shows (polar projection).


The image below combines the above two figures in two graphs, showing temperature anomalies over the past two decades.


Below are the full graphs for both the land-ocean data and the land-only data. Anomalies on land during the period 1890-1910 were 0.61°C lower compared to the period from 1951 to 1980, which is used as a reference to calculate anomalies. The blue line shows land-ocean data, while the red line shows data from stations on land only.


At the Paris Agreement, nations committed to strengthen the global response to the threat of climate change by holding the increase in the global average temperature to well below 2°C above pre-industrial levels and to pursue efforts to limit the temperature increase to 1.5°C above pre-industrial levels.

To see how much temperatures have risen compared to pre-industrial levels, a comparison with the period 1951-1980 does not give the full picture. The image below compares the February 2016 temperatures with the period from 1890 to 1910, again for land only.


Since temperatures had already risen by ~0.3°C (0.54°F) before 1900, the total temperature rise on land in February 2016 thus is 2.6°C (4.68°F) compared to the start of the industrial revolution.

There are a number of elements that determine how much the total temperature rise on land will be, say, a decade from now:

Rise 1900-2016: In February 2016, it was 2.3°C (4.14°F) warmer on land than it was in 1890-1910.

Rise before 1900: Before 1900, temperature had already risen by ~0.3°C (0.54°F), as Dr. Michael Mann points out (see earlier post).

Rise 2016-2026: If levels of carbon dioxide and further greenhouse gases do keep rising, there will additional warming over the next ten years. Even with dramatic cuts in carbon dioxide emissions, temperatures can keep rising, as maximum warming occurs about one decade after a carbon dioxide emission, so the full wrath of the carbon dioxide emissions over the past ten years is still to come. Moreover, mean global carbon dioxide grew by 3.09 ppm in 2015, more than in any year since the record started in 1959, prompting an earlier post to add a polynomial trendline that points at a growth of 5 ppm by 2026 (a decade from now). This growth took place while global energy-related CO2 emissions have hardly grown over the past few years, indicating that land and oceans cannot be regarded as a sink, but should be regarded as source of carbon dioxide. On land, carbon dioxide may be released due to land changes, changes in agriculture, deforestation and extreme weather causing droughts, wildfires, desertification, erosion and other forms of soil degradation. Importantly, this points at the danger that such emissions will continue to grow as temperatures keep rising. New studies on permafrost melt (such as this one and this one) show that emissions and temperatures can rise much faster in the Arctic than previously thought. Furthermore, a 2007 study found a 25% soil moisture reduction to result in 2°C warming. Altogether, the rise over the next decade due to such emissions may be 0.2°C or 0.36°F (low) to 0.5°C or 0.9°F (high).

Removal of aerosols: With the necessary dramatic cuts in emissions, there will also be a dramatic fall in aerosols that currently mask the full warming of greenhouse gases. From 1850 to 2010, anthropogenic aerosols brought about a decrease of ∼2.53 K, says a recent paper. In addition, more aerosols are likely to be emitted now than in 2010, so the current masking effect of aerosols may be even higher. Stopping aerosol release may raise temperatures by 0.4°C or 0.72°F (low) to 2.5°C or 4.5°F (high) over the next decade, and when stopped abruptly this may happen in a matter of weeks.

Albedo change: Warming due to Arctic snow and ice loss may well exceed 2 W per square meter, i.e. it could more than double the net warming now caused by all emissions by people of the world, as Professor Peter Wadhams calculated in 2012. The temperature rise over the next decade due to albedo changes as a result of permafrost and sea ice decline may be 0.2°C or 0.36°F (low) to 1.6°C or 2.9°F (high).

Methane eruptions from the seafloor: ". . . we consider release of up to 50 Gt of predicted amount of hydrate storage as highly possible for abrupt release at any time," Dr. Natalia Shakhova et al. wrote in a paper presented at EGU General Assembly 2008. Authors found that such a release would cause 1.3°C warming by 2100. Such warming from an extra 50 Gt of methane seems conservative when considering that there now is only some 5 Gt of methane in the atmosphere, and over a period of ten years this 5 Gt is already responsible for more warming than all the carbon dioxide emitted by people since the start of the industrial revolution. The temperature rise could be higher, especially in case of large abrupt release, but in case of small and gradual releases much of the methane may be broken down over the years. The temperature rise due to seafloor methane over the next decade may be 0.2°C or 0.36°F (low) to 1.1°C or 2°F (high).

Water vapor feedback:
 "Water vapour feedback acting alone approximately doubles the warming from what it would be for fixed water vapour. Furthermore, water vapour feedback acts to amplify other feedbacks in models, such as cloud feedback and ice albedo feedback. If cloud feedback is strongly positive, the water vapour feedback can lead to 3.5 times as much warming as would be the case if water vapour concentration were held fixed", according to the IPCC. In line with the above elements, this may result in a temperature rise over the next decade of 0.2°C or 0.36°F (low) to 2.1°C or 3.8°F (high).

The image below puts all these elements together in two scenarios, one with a relatively low temperature rise of 3.9°C (7.02°F) and another one with a relatively high temperature rise of 10.4°C (18.72°F).


Note that the above scenarios assume that no geoengineering will take place.

The 2.3°C warming used in above image isn't the highest figure offered by the NASA site. An even higher figure of 2.51°C warming can be obtained by selecting a 250 km smoothing radius for the on land data.

When adding the 0.3°C that temperatures rose before 1900, the rise from the start of the industrial revolution is 2.81°C (5.06°F), as illustrated by the image on the right.

The image also shows that this is the average rise. At specific locations, it is as much as 16.6°C (30°F) warmer than at the start of the industrial revolution.

Furthermore, temperatures are higher on the Northern Hemisphere than on the Southern Hemisphere. This is illustrated by the image below showing NASA temperature anomalies for January 2016 (black) and February 2016 (red) on land on the Northern Hemisphere. The data show that it was 2.36°C (4.25°F) warmer in February 2016 compared to 1951-1980.


How much of the rise can be attributed to El Niño? The added trendlines constitute one way to handle variability such as caused by El Niño and La Niña events and they can also indicate how much warming could be expected to eventuate over the years to come.

The February trendline also indicates that the temperature was 0.5°C lower in 1900 than in 1951-1980, so the total rise from 1900 to February 2016 is 2.86°C (5.15°F). Together with a 0.3°C rise before 1900, this adds up to a rise on land on the Northern Hemisphere of 3.16°C (5.69°F) from pre-industrial levels to February 2016. Most people on Earth live on land on the Northern Hemisphere. In other words, most people are already exposed to a temperature rise that is well above any guardrails that nations at the Paris Agreement pledged would not be crossed.


Temperatures may actually rise even more rapidly than these trendlines indicate. As above image illustrates, the largest temperature rises are taking place in the Arctic, resulting in a rapid decline of snow and ice cover and increasing danger that large methane eruptions from the seafloor will take place, as illustrated by the image on the right, from an earlier post. This could then further lead to more water vapor, while the resulting temperature rises also threaten to cause more droughts, heatwaves and wildfires that will cause further emissions, as well as shortages of food and fresh water supply in many areas.

Adding the various elements as discussed above indicates that most people may well be hit by a temperature rise of 4.46°C or 8.03°F in a low rise scenario and of 10.96°C or 19.73°F in a high rise scenario, and that would be in one decade from February 2016. Since it is now already March 2016, that is less than ten years from now.

The image below shows highest mean methane readings on one day, i.e. March 10, over four years, i.e. 2013, 2014, 2015 and 2016, at selected altitudes in mb (millibar). The comparison confirms that the increase of methane in the atmosphere is more profound at higher altitudes, as discussed in earlier posts. This could indicate that methane from the Arctic Ocean is hardly detected at lower altitudes, as it rises in plumes (i.e. very concentrated), while it will then spread and accumulate at higher altitudes and at lower latitudes.


The conversion table below shows the altitude equivalents in mb, feet and m.

57016 feet44690 feet36850 feet30570 feet25544 feet19820 feet14385 feet 8368 feet1916 feet
17378 m13621 m11232 m 9318 m 7786 m 6041 m 4384 m 2551 m 584 m
 74 mb 147 mb 218 mb 293 mb 367 mb 469 mb 586 mb 742 mb 945 mb

Meanwhile Arctic sea ice area remains at a record low for the time of the year, as illustrated by the image below.


Next to rising surface temperatures in the Arctic, ocean temperature rises on the Northern Hemisphere also contribute strongly to both Arctic sea ice decline and methane releases from the seafloor of the Arctic Ocean, so it's important to get an idea how much the Northern Hemisphere ocean temperature can be expected to rise over the next decade. The NOAA image below shows a linear trend over the past three decades that is rising by 0.19°C per decade.

The image below, using the same data, shows a polynomial trend pointing at a 1.5°C rise in ocean temperature on the Northern Hemisphere over the next decade.


Below is an interactive version of the graph.
The situation is dire and calls for comprehensive and effective action, as described in the Climate Plan.


There are a number of elements that determine how much the total temperature rise on land will be, say, a decade from...
Posted by Sam Carana on Sunday, March 13, 2016

Interview with Paul Beckwith

...


1) Hi Paul. Thanks for agreeing to do this interview. First of all, could you tell us a bit about your background, how long you’ve been involved in climate science, and what areas of climatology you specialize in?


Hello Sam. Thank you. It is my pleasure to have this interview with you.

I am an Engineer with a Bachelor of Engineering Degree in Engineering Physics (often called Engineering Science) from McMaster University in Hamilton, Ontario, Canada. I finished at the top of my class and received many scholarships and awards during my studies. My CV can be found on my website http://paulbeckwith.net under the About Me section.

I am a Physicist with a Master of Science Degree in Laser Physics. My research area was blowing molecules apart with high-powered CO2 lasers and measuring all the chunks flying off with low-power tunable diode lasers. This involved the science of molecular spectroscopy in the infrared region.

I worked in industry for many years, as a Product Line Manager for optical switching devices in high speed fiber optic communication systems, on high powered Excimer laser research and tunable laser research, and also on software quality assurance for various tech companies.

I have been interested in climate science my entire life. I decided to formally study it after becoming concerned with the lack of urgency by the public, scientists (literally everybody) about 6 years ago or so.

I am a part time professor in the Laboratory for Paleoclimatology in the Geography Department at the University of Ottawa. I have taught many courses including climatology, meteorology, oceanography and the geography of environmental issues. My research work in my PhD program is abrupt climate system change in the past and present, to determine what will happen in the near future. I am very active on educating the public about the grave dangers that we face from abrupt climate change, using primarily videos and blogs and public talks (see my website link above). My research is self-funded, apart from my teaching, and I greatly welcome financial contributions at the Please Donate button on the main task bar on my website.

2) It’s clear that the Arctic is melting rapidly and this trend is likely to continue. When do you predict the Arctic will start to have ice-free conditions? At what point during the year will it disappear, and how long for? How will these conditions develop in future decades, and could we reach a point where the Arctic is free of ice all year round?

I think that the Arctic will start to have ice-free conditions at the end of the melt season (Septembers) as early as 2020 or before (possibly even the summer of 2016). It is hard to predict a single year, since the loss of Arctic sea ice greatly depends on local Arctic wind and ocean conditions in the summer melt season. These local conditions determine how much ice is lost to export via the Fram Strait and Nares Strait, which makes a huge difference to ice loss amounts during the Northern summer period. When there is less than 1 million square kilometers of sea ice left, we have essentially a “blue-ocean” event in the Arctic.

For the sake of argument, lets pick September, 2020, for the first “blue-ocean” event in the Arctic (essentially no sea ice left). This would occur for about a month, call it the month of September. Within 2 or 3 years it is highly likely that the duration of this “blue-ocean” state would be 3 months or say, thus occur for August, September and October in 2023. Within an additional few years, say by 2025 it is highly likely that the “blue-ocean” event would be extended for another few additional months, and we would have ice free conditions from July through to and including November; namely for 5 months of the year. Then, within a decade or two from the initial 2020 event we can expect to have an ice free “blue-ocean” Arctic year round; that would be some year between 2030 and 2040.

Of course if the first “blue-ocean” event occurred in 2016 this timeline would be advanced accordingly.

3) In recent years, there’s been a lot of talk about methane eruptions in the Arctic and Siberia. How serious is this, in terms of its potential for adding to global warming? Can you give us some idea of the timescales involved? What’s the level of certainty about these future effects?

Once the Arctic is essentially ice free for ever increasing durations in the summer months, and then over the entire year there are two enormous feedback risks that we face. Methane and Greenland.

Methane is the mother of all risks. The Russians have measured large increases in emissions from the continental shelf seabed in the Eastern Siberian Arctic Shelf (ESAS). Over the timespan of a few years they observed that methane bubbled up in vast numbers of plumes that increased in size from tens of meters in diameter to hundreds and even thousands of meter diameter plumes in the shallow regions of ESAS. Global atmospheric levels of methane are rapidly rising, and although they average about 1900 ppb or so there have been readings over 3100 ppb in the atmosphere over the Arctic. Since the Global Warming Potential (GWP) of methane versus carbon dioxide is 34x, 86x and close to 200x on timescales of 100 years, 20 years and a few years, respectively a large burst of methane can virtually warm the planet many degrees almost overnight.

Recently, we have passed about 405 ppm of CO2, with a record rise of 3.09 ppm in 2015 alone. When accounting for methane and other greenhouse gases (GHGs) and putting them into CO2-equivalent numbers, we are at about 490 ppm CO2 – equivalent. We are literally playing with fire, and the outcome will not be pretty.

Greenland ice melt is the next enormous feedback risk. When we lose snow and ice in the Arctic, and the cascading feedbacks like albedo-destruction kick in, and the methane comes out then the enormous warming over Greenland and in the water around and under the Greenland ice will viciously destroy the ice there and greatly accelerate sea level rise. I refer people to my video from several years ago on the great risk of realizing 7 meters of global sea level rise by 2070 from Greenland and Antarctica melt.

The level of certainty over these future effects is close to 100% if we continue to be stupid and do nothing. If we are smart we need to have a Manhattan – Marshall plan like emergency status to:
a) Zero emissions as-soon-as-possible, i.e. by 2030;
b) Cool the Arctic to keep the methane in place and restore jet stream stability; and
c) Remove CO2 from the atmosphere/ocean system and remove methane from the atmosphere.
There is no other choice. I use the metaphor of a three legged bar stool with legs a), b) and c) as above.

Barstool approach (slightly different from text in that SRM and methane
removal are included with adaptation and conservation in bottom leg)


4) What new satellites, monitoring stations, and other science projects are being planned for the future (if any)? How will these improve our knowledge of the Arctic and the various climatic processes in the region?

NASA, the ESA and the Russians and Chinese are always launching new satellite with better high tech sensors to gather more information on the changes in the Earth System. We need to have a massive increase in scientific study in the Arctic to better quantify what is happening there. However, we know enough to see that if we do not deploy the three-legged barstool approach immediately then our chances are halting our ongoing abrupt climate change will vanish, and emissions from the Earth System will dwarf all cumulative anthropogenic emissions throughout human history. We need the US military budget of $700 to $800 billion dollars per year to be applied to saving human civilization from abrupt climate change.

5) What can be done to save the Arctic and reverse the melting trend? How long would it take to restore the ice cover to, say, mid-20th century levels? Is this even possible with current technology?

We must cool the Arctic as soon as possible using Solar Radiation Management (SRM) technologies. We can deploy SRM very quickly if we treat this Arctic temperature amplification as an existential threat to humanity and put billions of dollars into deployment. It will take many years, perhaps a decade to restore the ice cover but we must start now. If we wait until we have “blue-ocean” events before we deploy then our ability to restore the ice will be much harder and perhaps even futile.

Deployment is possible with current technology. I am specifically referring to Marine Cloud Brightening (MCB) methods. I am working today with people on these technologies.

6) How does the melting in the Arctic compare to its southern polar opposite, the Antarctic?

The Arctic is rapidly losing snow cover (mostly in the spring months) and sea ice cover, and is thus the average albedo (reflectivity) of the region is rapidly decreasing. This if feeding back into additional Arctic Temperature Amplification and further darkening and warming, until we have no snow and ice in the region. These vicious feedback cycles have not kicked in to the same extent in the Antarctic. The ice cap there is losing ice causing a rise in sea level mostly from the warming of the seawater undercutting the ice on land that is grounded below sea level. However, since the Arctic is warming so fast due to increased solar radiation absorption (from darkening) there is less heat transported there via the atmosphere and oceans. Thus, jet streams and ocean currents are slowing. Thus, more heat is moving from the equator to the southern hemisphere, making it to Australian latitudes and increasing the temperature gradient to Antarctica and thus increasing the speed of the jet streams there.

7) Finally, what’s your message to climate change deniers who reject the science and believe the whole thing is a giant hoax?

Climate change deniers cannot be tolerated by society any longer. They are threatening the future of everybody on our planet. Send them all to Guantanamo for intensive and mandatory climate science basic training, and when they get clued in they can be reintroduced into society.


Interview with Paul Beckwith http://arctic-news.blogspot.com/2016/03/interview-with-paul-beckwith.html
Posted by Sam Carana on Saturday, March 12, 2016

Samsung S5K2L1 ISOCELL vs Sony IMX260 Comparison

...
Phonearena quotes Finnish-language Taskumuro site making an unscientific comparison of Samsung Galaxy S7 equipped with Sony IMX260 and Samsung S5K2L1 dual-pixel AF sensors. One can judge the differences on real-life subjects with HDR mode off (many more pictures on the original site):

Sony sensor, click & download for full resolution
Samsung sensor, click & download for full resolution

More PhoneArena thoughts on the comparison is here.
1:20 AM

Ten Degrees Warmer In A Decade?

...
In 2015, mean global carbon dioxide grew by 3.09 parts per million (ppm), more than in any year since the record started in 1959. An added polynomial trendline points at a growth of 5 ppm by 2026 (a decade from now) and of 6 ppm by 2029.

NOAA data, added trend points at 5 ppm growth a decade from now
There are a number of elements that determine how much the total temperature rise will be, say, a decade from now:

Rise 1900-2016: In January 2016, it was 1.92°C (3.46°F) warmer on land than in January 1890-1910, as discussed in an earlier post that also featured the image below.

Rise before 1900: Before 1900, temperature had already risen by ~0.3°C (0.54°F), as Dr. Michael Mann points out.

Rise 2016-2026: The image at the top shows a trend pointing at 5 ppm growth a decade from now. If levels of carbon dioxide and further greenhouse gases keep rising, then that will account for additional warming over the next ten years. Even with dramatic cuts in carbon dioxide emissions, temperatures will keep rising, as maximum warming occurs about one decade after a carbon dioxide emission, so the full wrath of the carbon dioxide emissions over the past ten years is still to come.

Removal of aerosols: With dramatic cuts in emissions, there will also be a dramatic fall in aerosols that currently mask the full warming of greenhouse gases. From 1850 to 2010, anthropogenic aerosols brought about a decrease of ∼2.53 K, says a recent paper. In addition, people will have emitted a lot more aerosols since 2010.

Albedo change: Warming due to Arctic snow and ice loss may well exceed 2 W per square meter, i.e. it could more than double the net warming now caused by all emissions by people of the world, calculated Professor Peter Wadhams in 2012.

Methane eruptions from the seafloor: ". . . we consider release of up to 50 Gt of predicted amount of hydrate storage as highly possible for abrupt release at any time," Dr. Natalia Shakhova et al. wrote in a paper presented at EGU General Assembly 2008. Authors found that such a release would cause 1.3°C warming by 2100. Note that such warming from an extra 50 Gt of methane seems conservative when considering that there now is only some 5 Gt of methane in the atmosphere, and over a period of ten years this 5 Gt is already responsible for more warming than all the carbon dioxide emitted by people since the start of the industrial revolution.

Water vapor feedback: Water vapour feedback acting alone approximately doubles the warming from what it would be for fixed water vapour. Furthermore, water vapour feedback acts to amplify other feedbacks in models, such as cloud feedback and ice albedo feedback. If cloud feedback is strongly positive, the water vapour feedback can lead to 3.5 times as much warming as would be the case if water vapour concentration were held fixed, according to the IPCC.

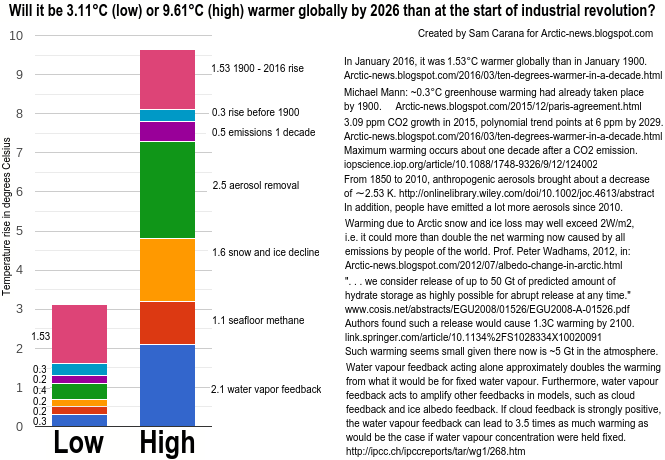
The image below puts these elements together in two scenarios, one with a relatively low temperature rise of 3.5°C (6.3°F) and another one with a relatively high temperature rise of 10°C (18°F).

Temperature rise on land a decade from now (without geoengineering)
Note that the above scenarios assume that no geoengineering will take place within a decade.
[ click on images to enlarge ]

As described above, the January 2016 temperature anomaly on land compared to January 1890-1910 was 1.92°C (3.46°F). Globally, the anomaly was 1.53°C (2.75°F), as shown by the image top right.

Putting the elements together for two global scenarios will result in a total rise of 3.11°C (5.6°F) for a relatively low global temperature rise and 9.61°C (17.3°F) for a relatively high global temperature rise, as shown by the image bottom right.

So, will climate catastrophe occur in a decade or later? There are many indications that the odds are large and growing rapidly. Some say climate catastrophe is inevitable or is already upon us. Others may like to believe the odds were rather small. Even so, the magnitude of the devastation makes it imperative to start taking comprehensive and effective action now.


The situation is dire and calls for comprehensive and effective action, as described in the Climate Plan.


In 2015, mean global CO2 grew by 3.09 parts per million, more than in any year since the record started in 1959. An...
Posted by Sam Carana on Wednesday, March 9, 2016

Wind Direction that influence the Plot plan

...


Wind Direction that influence the Plot plan

 Wind Direction


·        
Prevailing wind conditions influence the design
considerations for the location of the flare or vent stack.  It is important that reliable wind data is
obtained for the proposed location of the facility.  In this respect, safe design requirements
will typically require the following:
3:21 AM

MEMS Drive and OPPO Joint PR

...
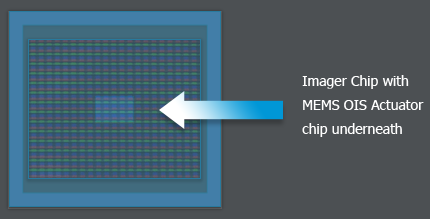
PRWeb: MEMS Drive and OPPO come up with a joint press release on their MEMS-based SmartSensor, the first image sensor-based image stabilizer for smartphones, also said to be the industry’s first sub-pixel-level optical image stabilizer.

While VCM smartphone cameras are limited to shake compensation on just two axes of movement, the new MEMS-based approach compensates for motion on three axes. This additional degree of mobility is said to vastly outperform traditional OIS technologies for smartphones, because it is faster – compensating for vibrations in 15 ms compared to 50 ms for lens-based technologies – and more accurate, and it allows for significantly lower power consumption.

MEMS Drive was founded to develop and advance the field of MEMS OIS technology for smartphone cameras. “The collaboration with OPPO has been very successful. The fact that OPPO is taking such an active role in co-developing this technology with MEMS Drive is accelerating our roadmap, and will ultimately come to benefit smartphone users sooner,” said Colin Kwan, CEO and founder of MEMS Drive.

“OPPO recognized that the MEMS Drive OIS actuator could vastly improve the end users’ camera experience. We therefore decided to invest in MEMS Drive and to co-develop the SmartSensor image stabilizer, and bring yet another significant advance in smartphone technology to market,” said King Liu, VP of Product Development at OPPO.

The advantages of MEMS Drive OIS are:
  • 3 Axis stabilization: pitch, yaw and roll
  • Fast (MEMS advantage)
  • Low power consumption
  • High precision
  • Built-in 2 Axis accelerometer
  • Compatible with any existing AF, shutter and Zoom actuators
  • 3D capture
  • Super resolution

11:12 PM

Sharp Imaging Sales Keep Climbing

...
I missed this news from about a month ago, when Sharp presented the quarterly results for its fiscal Q3, ended on Dec. 31, 2015. Its imaging products sales rise nicely to all times high:

11:33 AM

NIT Introduces WDR InGaAs Sensor

...
New Imaging Technologies introduces the NSC1401, an analog WDR QVGA InGaAs sensor series. The sensor uses a new generation of ROIC with a 320x256 pixels at 25um pitch coupled to an InGaAs retina that operates in WDR mode and global shutter. The spectral response ranges from 900nm to 1700nm. Its AFE provides ultra fast response time down to 200ns for applications such as active imaging. The sensor operates both in linear integration mode and in log response at speeds up to 300fps at full resolution.


One of NIT customers postes a WDR video shot with its older NSC1003 GS sensor:

11:19 AM

Samsung Announces its Own Dual Pixel AF Sensor

...
BusinessWire: Samsung announces its 12MP, 1.4um dual pixel sensor for smartphones, already in mass production. The dual pixel is said to enable rapid AF even in low light situations.

“With 12 million pixels working as a phase detection auto-focus (PDAF) agent, the new image sensor brings professional auto-focusing performance to a mobile device,” said Ben K. Hur, VP Marketing, System LSI Business at Samsung. “Consumers will be able to capture their daily events and precious moments instantly on a smartphone as the moments unfold, regardless of lighting conditions.”

The new image sensor employs two PDs located on the left and right halves of a pixel, while a conventional PDAF-equipped sensor dedicates less than 5% of its pixels, with one photodiode each that converts light particles into measurable photocurrent for phase detection. As each and every pixel of the Dual Pixel image sensor is capable of detecting phase differences of perceived light, significantly faster auto-focus has become possible, especially for moving objects even in poor lighting conditions.

The image sensor has also adopted Samsung’s ISOCELL technology, which isolates the photodiodes in each pixel with a physical wall to further reduce color cross talk, maximizing the image sensor’s performance.

The new image sensor is built with chip-stacking technology: a 65nm sensor on top of 28nm logic chip.


Meanwhile, GSMArena found an unscientific Youtube comparison of speeds of Galaxy S7 dual pixel AF and Canon EOS 70D DSLR dual pixel AF:


9:09 AM

Sony IMX260 in Samsung Galaxy S7: Stacked or Not?

...
Chipworks publishes an update on Sony IMX260 dual pixel AF sensor, found in Samsung Galaxy S7:

"Our lab staff have completed the initial cross-sectioning work for our IMX260 project and we have a substantial update to share: the Sony IMX260 is, in fact, a stacked chip CMOS image sensor! As mentioned, we had expected to find through silicon vias (TSVs) consistent with Sony’s Exmor RS technology platform. Our early teardown results revealed what appeared to be a conventional Sony non-stacked back-illuminated (Exmor R) chip. After going deeper inside, we see that Sony is leading the digital imaging sector into an era of hybrid bonding. It’s not currently known if Sony considers this an extension of its Exmor RS platform, or if the IMX260 marks the first of a new (as of now unannounced) family of back-illuminated image sensors. For now we consider the IMX260 to be a 3rd generation Exmor RS chip.

Our cross-section reveals a 5 metal (Cu) CMOS image sensor (CIS) die and a 7 metal (6 Cu + 1 Al) image signal processor (ISP) die. The Cu-Cu vias are 3.0 µm wide and have a 14 µm pitch in the peripheral regions. In the active pixel array they are also 3.0 µm wide, but have a pitch of 6.0 µm. Note that in the images we’ve included we do see connections from the Cu-Cu via pads to both CIS and ISP landing pads.
"

12:14 PM

Teledyne DALSA on Industry Consolidation

...
DALSA publishes an article "Image Sensor Basics: Changes in the marketplace mean benefits for customers" in Quality Magazine. Few quotes:

"Major industry players—such as ON Semiconductor, CMOSIS, e2v, and Sony — have grown even larger as they’ve acquired smaller challengers, yet they continue to compete to strengthen their hold on existing markets and their competitive position with new customers as the demand for devices that rely on image sensors expands.

For end customers, industry consolidation means the promise of innovation leading to new, higher-quality sensors that deliver greater features and functionality, and are available at a lower cost.

The image sensor industry holds a vast repository of intellectual property and consolidation among former competitors will result in the integration of this intellectual property and the sharing of best practices, which in turn, should facilitate improved image sensor quality. In fact, CMOS image sensor quality has already improved in recent years.

The cost of image sensors and the price of the cameras or other products in which they’re incorporated will continue to decrease as the remaining competitors jockey for expanded market share, and consumers will be the beneficiaries.
"
11:54 AM

First Photon Imaging

...
Boston University Associate Professor Vivek Goyal lecture "First-Photon Imaging and Other Imaging with Few Photons" is published on Vimeo:

Abstract:
"LIDAR systems use single-photon detectors to enable long-range reflectivity and depth imaging. By exploiting an inhomogeneous Poisson process observation model and the typical structure of natural scenes, first-photon imaging demonstrates the possibility of accurate LIDAR with only 1 detected photon per pixel, where half of the detections are due to (uninformative) ambient light. I will explain the simple ideas behind first-photon imaging. Then I will present related subsequent works that enable the use of detector arrays and improve robustness to ambient light."

12:32 PM

Sr. Piping Engineer - UK (Amec Foster Wheeler)

...


Senior Piping Engineer

Requisition ID 

2016-10078

Work Location 

GB-Cheshire-Knutsford

Department /
Discipline 

Engineering - Piping

Additional Work
Location 

..

Position Type 

Staff / Permanent

Job
Description

Overview
/ Responsibilities

Amec Foster Wheeler is currently
recruiting for a Senior Piping Engineer with extensive experience in
the oil and gas petrochemical industry.
5:04 AM

Will Brake Problems Slow Down Ford's F-150 Pickup?

...

On Mar. 4, the U. S. National Highway Traffic Safety Administration (NHTSA) announced that it was launching an investigation into brake failures of Ford's popular F-150 pickup trucks.  The agency claims that nearly half a million 2013 and 2014 models could have brakes that suddenly fail completely.  While no fatalities have yet been associated with the failures, the NHTSA has received 20 complaints of this problem in the last seven months, including four incidents that resulted in non-injury crashes.  Ford has responded that it will cooperate fully with the investigation.

In the automotive industry, the F-150 is a legendary success story.  It is the single best-selling vehicle in the U. S., and if Texas had a contest to name the state automobile, the F-150 would win hands down.  This is despite the fact that few F-150 owners routinely carry a half ton or more of stuff in the truck bed.  In other words, people buy pickup trucks for reasons other than practicality.  As any TV ad for pickups will show, the automakers have spent millions to associate pickup trucks with virility, toughness, and other he-man qualities.  The Wikipedia article on pickup trucks puts it this way:  "In America pickups are favored by low fuel prices, taxes and regulations that distort the market in favor of domestically built trucks, and a cultural attachment to the style."  (I especially like that "cultural attachment to the style.")  Ford has parlayed this attachment into a huge share of the U. S. automotive market, and with today's historically low fuel prices, the popularity of pickups shows no sign of abating.

But stopping a vehicle that weighs up to 2 tons (1800 kg) unloaded and more than 3 tons (2700 kg) loaded is no simple matter, so power-assisted brakes are standard on these vehicles.  Most brake boosters, as they are called, use a diaphragm actuated by a partial vacuum taken from the intake manifold or other source.  When the driver applies the brakes, this motion opens a valve that adds the force from the diaphragm to the brake-pedal force, and applies much greater force on the hydraulic master cylinder than one's foot can ordinarily supply.  If the booster fails, the brakes still work, but it takes much greater force for a given braking effect.

While it is too early to determine what may be going on with the F-150 brakes, it's easy to see what could go wrong with such a system.  Complaints to online auto-mechanic help websites about F-150 brakes indicate that in several cases, the brakes totally failed:  the brake pedal went to the floor and no braking happened.  When the vehicle was towed to the shop, no external signs of leakage were found but the master cylinder had no brake fluid in it.  That fluid had to go somewhere, and my guess is that a seal broke or an accidental passageway was formed between the master cylinder's high pressure and the vacuum in the brake-assist system, sucking the fluid into the vacuum system of the power assist. 

I have never worked on brakes more advanced than those in a 1955 Olds, and my idea of what is wrong with the F-150 brakes may be total nonsense.  But the NHTSA doesn't think the complaints are nonsense, and now both Ford and the government are trying to find out what's happening.

Besides this specific case, there may be something bigger going on with regard to the way the NHTSA is treating consumer complaints.  The Detroit News quotes NHTSA Administrator Mark Rosekind as saying recently that we are now in the era of the "Big Recall," which he says is not a good thing.  As anyone who has looked into the matter knows, automakers are constantly fielding complaints of flocks of problems of all kinds ranging from the trivial—interior trim that fades oddly in sunlight, for example—to the deadly, like the GM ignition-switch debacle I wrote about in this space in 2014.  The problem the automakers face is to allocate their limited investigative and engineering resources so that the truly dangerous problems get addressed promptly—hopefully before anyone gets killed—and the less serious ones are dealt with as time permits.  This is an art as much as it is a science, and historically the NHTSA has limited its involvement to situations where fatalities were involved and a serious defect could be identified.

The NHTSA's action in this brake-failure problem is not unprecedented, but is unusual in that no fatalities or even injuries have been reported in connection with the problem.  And the total number of complaints—about 30 in the last year—is not all that large, considering the millions of F-150s out there on the roads.  Perhaps this is the NHTSA's attempt to head a problem off at the pass, so to speak, before anybody does get killed as a result of an F-150's brake failure.  In any event, Ford has been called on the public carpet concerning the issue, and they now have no choice but to come up with documents requested by the government before April 20, or face large financial penalties. 

Has Ford done anything wrong?  That remains to be seen.  The NHTSA's action falls into the category of what legal specialists call "administrative law," which is in a kind of gray area between laws explicitly passed by legislatures, and arbitrary and capricious bullying by out-of-control government agency administrators.  As federal agencies go, the NHTSA has been fairly well-behaved compared to, for example, the Environmental Protection Administration, which has landed in the U. S. Supreme Court numerous times for what some say is vast overreaching of its statutory authority. 

There are good reasons to treat a large corporation like Ford differently than one would treat a private individual.  And in using complaints from private individuals to build a case against Ford, in that sense NHTSA is looking out for the little guy.  But it is easy to imagine how the NHTSA could overdo the thing by pestering Ford about every little complaint that could conceivably result in an injury.  So far, they don't seem to be doing that, but there is nothing except the integrity of NHTSA officials to keep the agency from going overboard.

The best outcome of this situation will be if Ford finds a definite cause for the brake failures and fixes it.  This might involve a massive recall, but we are almost used to those now.  Even if millions of F-150s are recalled, there is little chance that the American consumer will quit buying his favorite pickup.  The NHTSA is no match for all those he-man pickup ads. 

Sources:  I referred to the articles on the F-150 brake problem carried on Mar. 4 by Autoweek online at http://autoweek.com/article/car-news/nhtsa-investigating-brake-problems-2013-14-ford-f-150and by the Detroit News at http://www.detroitnews.com/story/business/autos/ford/2016/03/04/ford-investigation/81310176/.  I also referred to the Wikipedia articles "Ford F-series," "pickup truck," and "vacuum servo."  I blogged on the GM ignition switch recall last year on Apr. 7, 2014 and June 9, 2014.

Brillnics Patent Applications Published

...
Many have been wondering what Junichi Nakamura's startup Brillnics is working on, especially after TSMC pixel group head S.G. Wuu has joined them. Two PCT patent applications might shed some light on it:

WO2016009942: SOLID STATE IMAGING DEVICE, METHOD FOR PRODUCING SOLID STATE IMAGING DEVICE, AND ELECTRONIC APPARATUS by TAKAYANAGI, Isao; TANAKA, Shunsuke; MORI, Kazuya; ARIYOSHI, Katsuhiko; MATSUO, Shinichiro.

WO2016009943: SOLID-STATE IMAGING DEVICE, METHOD FOR PRODUCING SOLID-STATE IMAGING DEVICE, AND ELECTRONIC APPARATUS by AKAYANAGI, Isao; TANAKA, Shunsuke; MORI, Kazuya; ARIYOSHI, Katsuhiko; MATSUO, Shinichiro.

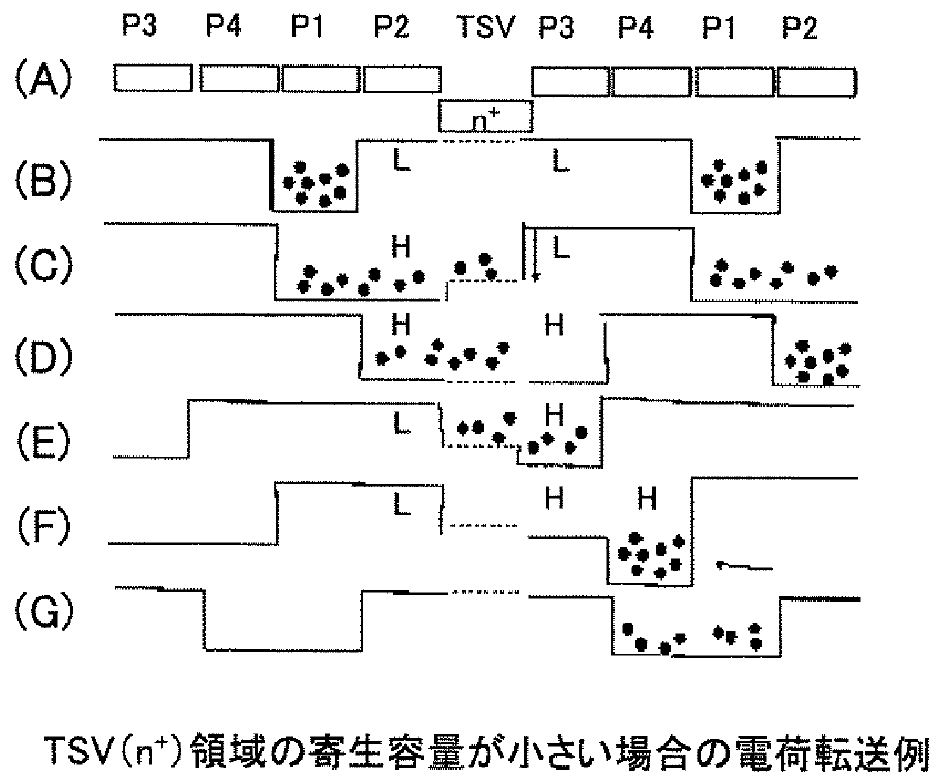
While the detailed description is in Japanese, just from the abstract and figures, it appears to be a stacked sensor built on CMOS pixel with CCD-like charge transfer and storage:

"This solid-state imaging device 100 has: a light sensitive unit that includes pixel units 211, which are disposed in a matrix, and charge forwarding units 212 for forwarding, by the column, the signal charge of the pixel units; a plurality of charge accumulation units 220 that accumulate the signal charges forwarded by the plurality of charge forwarding units of the light sensitive unit; a relay unit 240 that relays the forwarding of the signal charges forwarded by the plurality of charge accumulation units to each charge accumulation unit; an output unit 230 that outputs the signal charges of the plurality of charge accumulation units as electric signals; a first substrate 110 at which the light sensitive unit 210 is formed; and a second substrate 120 at which the charge accumulation unit 220 and output unit 230 are formed. The first substrate and second substrate are laminated together, and the relay unit 240 electrically couples the charge forwarding unit of the first substrate to the charge accumulation unit of the second substrate by means of a connection section traversing the substrates outside the light sensitive region of the light sensitive unit."


The most interesting part is a charge transfer between the stacked dies through TSV:

6:05 AM

Senior Designer - Piping

...


Senior Designer - Piping - AL 00I4

Company: WorleyParsons


Primary Location:  SAU-EP-Al Khobar


Job:  Piping


Schedule:  Full-time


Employment Type:  Staff

Job Level:  Experienced


Job Posting
:  Feb 7, 2016


Unposting Date:  Mar 9, 2016


Reporting Manager Title:  Piping Manager


WorleyParsons is a dynamic, entrepreneurial EPCM company employing approximately 35,600 people in
2:07 AM