Showing posts with label clathrates. Show all posts

High Methane Levels Follow Earthquake in Arctic Ocean

...
In the 12 months up to July 14, 2016, 48 earthquakes with a magnitude of 4 or higher on the Richter scale hit the map area of the image below, mostly at a depth of 10 km (6.214 miles).


As temperatures keep rising and as melting of glaciers keeps taking away weight from the surface of Greenland, isostatic rebound can increasingly trigger earthquakes around Greenland, and in particular on the faultline that crosses the Arctic Ocean.

Two earthquakes recently hit the Arctic Ocean. One earthquake hit with a magnitude of 4.5 on the Richter scale on July 9, 2016. The other earthquake hit with a magnitude of 4.7 on the Richter scale on July 12, 2016, at 00:15:24 UTC, with the epicenter at 81.626°N 2.315°W and at a depth of 10.0 km (6.214 miles), as illustrated by the image below.


Following that most recent earthquake, high levels of methane showed up in the atmosphere on July 15, 2016, over that very area where the earthquake hit, as illustrated by the image below.


Above image shows that methane levels were as high as 2505 ppb at an altitude of 4,116 m or 13,504 ft on the morning of July 15, 2016. At a higher altitude (of 6,041 m or 19,820 ft), methane levels as high as 2598 ppb were recorded that morning and the magenta-colored area east of the north-east point of Greenland (inset) looks much the same on the images in between those altitudes. All this indicates that the earthquake did cause destabilization of methane hydrates contained in sediments in that area.

Above image, from another satellite, confirms strong methane releases east of Greenland on the afternoon of July 14, 2016, while the image below shows high methane levels on July 16, 2016, along the faultline that crosses the Arctic Ocean.


The image on the right shows glaciers on Greenland and sea ice near Greenland and Svalbard on July 15, 2016. Note that clouds partly obscure the extent of the sea ice decline.


Above image shows the sea ice on July 12, 2016. There is a large area with very little sea ice close to the North Pole (left) and there is little or no sea ice around Franz Josef Land (right). Overall, sea ice looks slushy and fractured into tiny thin pieces. All this is an indication how warm the water is underneath the sea ice.

[ click on image to enlarge ]
In addition to the shocks and pressure changes caused by earthquakes, methane hydrate destabilization can be triggered by ocean heat reaching the seafloor of the Arctic Ocean. Once methane reaches the atmosphere, it can very rapidly raise local temperatures, further aggravating the situation.

Temperatures are already very high across the Arctic, as illustrated by the image below, showing that on July 16, 2016, it was 1.6°C or 34.8°F over the North Pole (top green circle), while it was 32.7°C or 90.8°F at a location close to where the Mackenzie River flows into the Arctic Ocean (bottom green circle).

Arctic sea ice is in a very bad shape, as also illustrated by the Naval Research Laboratory nowcast below.


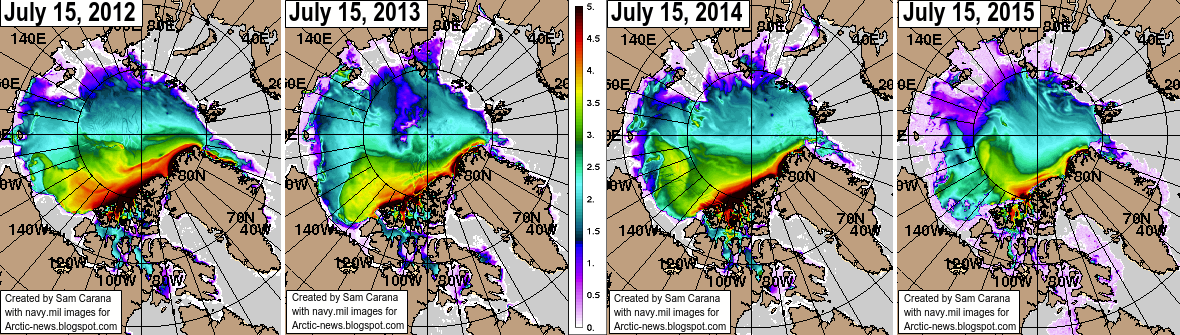
Sea ice thickness has fallen dramatically over the years, especially the ice that was more than 2.5 m thick. The image below compares the Arctic sea ice thickness (in m) on July 15, for the years from 2012 (left panel) to 2015 (right panel), using Naval Research Laboratory images.

[ Click on image to enlarge ]
The image below shows sea surface temperature anomalies from 1961-1990 on July 24, 2016.


Sea surface temperatures off the coast of America are high and much of this ocean heat will be carried by the Gulf Stream toward the Arctic Ocean over the next few months.


On July 24, 2016, sea surface temperature near Florida was as high as 33.2°C or 91.7°F, an anomaly of 3.7°C or 6.6°F from 1981-2011 (bottom green circle), while sea surface temperature near Svalbard was as high as 17.3°C or 63.2°F, an anomaly of 12.6°C or 22.8°F from 1981-2011 (top green circle).

A cold freshwater (i.e. low salinity) lid sits on top of the ocean and this lid is fed by precipitation (rain, hail, snow, etc.), melting sea ice (and icebergs) and water running off the land (from rivers and melting glaciers on land). This lid reduces heat transfer from ocean to atmosphere, and thus contributes to a warmer North Atlantic where huge amounts of heat are now carried underneath this lid toward the Arctic Ocean. The danger is that more ocean heat arriving in the Arctic Ocean will destabilize clathrates at the seafloor and result in huge methane eruptions, as discussed in earlier posts such as this one.

As temperatures keep rising, snow and ice in the Arctic will decline. This could result in some 1.6°C or 2.88°F of warming due to albedo changes (i.e. due to decline both of Arctic sea ice and of snow and ice cover on land). Additionally, some 1.1°C or 2°F of warming could result from methane releases from clathrates at the seafloor of the world's oceans. As discussed in an earlier post, this could eventuate as part of a rise from pre-industrial levels of as much as 10°C or 18°F, by the year 2026.

[ click on image to enlarge ]


The impact of rising temperatures will be felt firstly and most strongly in the Arctic, where global warming is accelerating due to numerous feedbacks that can act as self-reinforcing cycles.

Already now, this is sparking wildfires across the Arctic.

Above image shows wildfires (indicated by the red dots) in Alaska and north Canada, on July 15, 2016.

The image on the right shows smoke arising from wildfires on Siberia. The image below shows that, on July 18, 2016, levels of carbon monoxide (CO) over Siberia were as high as 32318 ppb, and in an area with carbon dioxide (CO2) levels as low as 345 ppm, CO2 reached levels as high as 650 ppm on that day.

[ click on images to enlarge them ]
The image below shows the extent of smoke from wildfires in Siberia on July 23, 2016.


The image below shows high methane levels over Siberia on July 19, 2016.


The image below, from the MetOp satellite, shows high methane levels over Siberia on July 21, 2016.

Below are further images depicting mean global methane levels, from 1980-2016 (left) and 2012-2016 (right).

The image below shows methane levels at Barrow, Alaska.


The image below shows that, while methane levels may appear to have remained stable over the past year when taking measurements at ground level, at higher altitudes they have risen strongly.


The conversion table below shows the altitude equivalents in feet, m and mb.
57016 feet44690 feet36850 feet30570 feet25544 feet19820 feet14385 feet 8368 feet1916 feet
17378 m13621 m11232 m 9318 m 7786 m 6041 m 4384 m 2551 m 584 m
 74 mb 147 mb 218 mb 293 mb 367 mb 469 mb 586 mb 742 mb 945 mb

The situation is dire and calls for comprehensive and effective action, as described at the Climate Plan.


Three kinds of warming in the Arctic

...
The Arctic is prone to suffer from three kinds of warming. Firstly, the Arctic is hit particularly hard by emissions, as discussed in earlier posts such as this one and this one.

Secondly, warming in the Arctic is accelerating due to feedbacks, as discussed on the feedbacks page. Many such feedbacks are related to decline of the snow and ice cover in the Arctic, which is in turn made worse by emissions such as soot.

Thirdly, the most dangerous feedback is release of methane from the Arctic Ocean seafloor, due to hydrates getting destabilized as heat reaches sediments.


Last year, Arctic sea ice reached its maximum extent on February 25, 2015. This year, there was a lot less sea ice in the Arctic on February 25 than there was last year, as illustrated by above image. The difference is about 300,000 square km, more than the size of the United Kingdom.

The image below shows that global sea ice on February 22, 2016, was only 14.22086 million square km in area. It hasn't been that low since satellite records started to measure the sea ice.


A number of feedbacks are associated with the decline of sea ice, such as more sunlight being absorbed by the water, instead of being reflected back into space as it was previously. Furthermore, there are three kinds of warming active in the Arctic, as described above and as depicted by the image below.


Sea ice can reflect as much as 90% of the sunlight back into space. Once the ice has melted away, however, the water of the ocean reflects only 6% of the incoming solar radiation and absorbs the rest. This is depicted in above image as feedback #1.


As Professor Peter Wadhams once calculated, warming due to Arctic snow and ice loss could more than double the net warming now caused by all emissions by all people of the world.

Professor Peter Wadhams on albedo changes in the Arctic, image from Edge of Extinction
As the sea ice melts, sea surface temperatures will remain at around zero degree Celsius (32°F) for as long as there is ice in the water, since rising ocean heat will first go into melting the ice. Only after the ice has melted will ocean heat start raising the temperature of the water. Sea ice thus acts as a buffer that absorbs heat, preventing water temperatures from rising. As long as sea ice is melting, each gram of ice will take 334 Joule of heat to change into water, while the temperature remains at 0° Celsius or 32° Fahrenheit.

Once all ice has turned into water, all further heat goes into heating up the water. To raise the temperature of one gram of water by one degree Celsius then takes only 4.18 Joule of heat. In other words, melting of the ice absorbs 8 times as much heat as it takes to warm up the same mass of water from zero to 10°C. This is depicted in the image on the right as feedback #14.


Above video, created by Stuart Trupp, shows how added heat at first (A) goes mainly into warming up water that contains ice cubes. From about 38 seconds into the movie, all heat starts going into the transformation of the ice cubes into water, while the temperature of the water doesn't rise (B). More than a minute later, as the ice cubes have melted (C), the temperature of the water starts rising rapidly again.

Methane is a further feedback, depicted as feedback #2 on the image further above. As the water of the Arctic Ocean keeps getting warmer, the danger increases that heat will reach the seafloor where it can trigger release of huge amounts of methane, in an additional feedback loop that will make warming in the Arctic accelerate and escalate into runaway warming.

Sediments underneath the Arctic Ocean hold vast amounts of methane. Just one part of the Arctic Ocean alone, the East Siberian Arctic Shelf (ESAS, see map below), holds up to 1700 Gt of methane. A sudden release of less than 3% of this amount could add 50 Gt of methane to the atmosphere, and experts have warned for many years that they consider such an amount to be ready for release at any time.


Above image gives a simplified picture of the threat, showing that of a total methane burden in the atmosphere of 5 Gt (it is meanwhile higher), 3 Gt that has been added since the 1750s, and this addition is responsible for almost half of all antropogenic global warming. The amount of carbon stored in hydrates globally was in 1992 estimated to be 10,000 Gt (USGS), while a more recent estimate gives a figure of 63,400 Gt (Klauda & Sandler, 2005). Once more, the scary conclusion is that the East Siberian Arctic Shelf (ESAS) alone holds up to 1700 Gt of methane in the form of methane hydrates and free gas contained in sediments, of which 50 Gt is ready for abrupt release at any time.

The warning signs keep getting stronger. Following a peak methane reading of 3096 ppb on February 20, 2016, a reading of 3010 ppb was recorded in the morning of February 25, 2016, at 586 mb (see image below).

Again, this very high level was likely caused by methane originating from the seafloor of the Arctic Ocean, at a location on the Gakkel Ridge just outside the East Siberian Arctic Shelf (ESAS), as discussed in the earlier post. This conclusion is supported by the methane levels at various altitudes over the ESAS, as recorded by both the MetOp-1 and MetOp-2 satellites in the afternoon, as illustrated by the combination image below showing methane levels at 469 mb.


The situation is dire a calls for comprehensive and effective action as described in the Climate Plan.


Links

- Feedbacks in the Arctic
http://arctic-news.blogspot.com/p/feedbacks.html

- Albedo changes in the Arctic
http://arctic-news.blogspot.com/2012/07/albedo-change-in-arctic.html

- The time has come to spread the message
http://arctic-news.blogspot.com/2013/12/the-time-has-come-to-spread-the-message.html

- Greenhouse gas levels and temperatures keep rising
http://arctic-news.blogspot.com/2016/01/greenhouse-gas-levels-and-temperatures-keep-rising.html

- Arctic sea ice area at record low for time of year
http://arctic-news.blogspot.com/2016/01/arctic-sea-ice-area-at-record-low-for-time-of-year.html

- Has maximum sea ice extent already been reached this year?
http://arctic-news.blogspot.com/2016/02/has-maximum-sea-ice-extent-already-been-reached-this-year.html

- Global sea ice extent record minimum - Arctic Sea Ice Blog
http://neven1.typepad.com/blog/2016/02/global-sea-ice-extent-minimum-record.html

- Warming of the Arctic Fueling Extreme Weather
http://arctic-news.blogspot.com/2014/06/warming-of-the-arctic-fueling-extreme-weather.html

- Climate Plan
http://arctic-news.blogspot.com/p/plan.html


Last year, Arctic sea ice reached its maximum extent on February 25, 2015. This year, there's a lot less sea ice in the...
Posted by Sam Carana on Friday, February 26, 2016

Ocean Heat Depth

...
Ocean heat at the equator


On November 24, 2015, equatorial waters at ≈100 m (328 ft) depth at 110-135°W were over 6°C (10.8°F) warmer than average in 1981-2000, as illustrated by above image. The animation below shows equatorial ocean heat over the past few months, illustrating that temperature anomalies greater than 6°C (10.8°F) occurred throughout this period at depths greater than 100 m (328 ft).

The danger of ocean heat destablizing clathrates in the Arctic

The danger is that ever warmer water will reach the seafloor of the Arctic Ocean and destabilize methane that is held there in sediments the form of free gas and hydrates.

So, how comparable is the situation at the equator with the situation in the Arctic? How much heating of the Arctic Ocean has taken place over the past few years?

The image on the right, produced with NOAA data, shows mean coastal sea surface temperatures of over 10°C (50°F) in some areas in the Arctic on August 22, 2007.

In shallow waters, heat can more easily reach the bottom of the sea. In 2007, strong polynya activity caused more summertime open water in the Laptev Sea, in turn causing more vertical mixing of the water column during storms in late 2007, according to this study, and bottom water temperatures on the mid-shelf increased by more than 3°C (5.4°F) compared to the long-term mean.

This study finds that drastic sea ice shrinkage causes increase in storm activities and deepening of the wind-wave-mixing layer down to depth ~50 m (164 ft) that enhance methane release from the water column to the atmosphere. Indeed, the danger is that heat will warm up sediments under the sea, containing methane in hydrates and as free gas, causing large amounts of this methane to escape rather abruptly into the atmosphere.

The image below, replotted by Leonid Yurganov from a study by Chepurin et al, shows sea water temperature at different depths in the Barents Sea, as described in an earlier post.


The image below is from a study published in Nature on November 24, 2013, showing water temperatures measurements taken in the Laptev Sea from 1999-2012.

Water temperatures in Laptev Sea. Red triangles: summer. Blue triangles: winter. Green squares: historic data.
From Shakhova et al., (2013) doi:10.1038/ngeo2007
Before drawing conclusions, let's examine some peculiarities of the Arctic Ocean more closely, specifically some special conditions in the Arctic that could lead to greater warming than elsewhere and feedbacks that could accelerate warming even more.

Amount of methane ready for release

Sediments underneath the Arctic Ocean hold vast amounts of methane. Just one part of the Arctic Ocean alone, the East Siberian Arctic Shelf (ESAS, rectangle on map below, from the methane page), holds up to 1700 Gt of methane. A sudden release of just 3% of this amount could add over 50 Gt of methane to the atmosphere, and experts consider such an amount to be ready for release at any time (see above image).


Total methane burden in the atmosphere now is 5 Gt. The 3 Gt that has been added since the 1750s accounts for almost half of the (net) total global warming caused by people. The amount of carbon stored in hydrates globally was in 1992 estimated to be 10,000 Gt (USGS), while a more recent estimate gives a figure of 63,400 Gt (Klauda & Sandler, 2005). The ESAS alone holds up to 1700 Gt of methane in the form of methane hydrates and free gas contained in sediments, of which 50 Gt is ready for abrupt release at any time.


Imagine what kind of devastation an extra 50 Gt of methane could cause. Imagine the warming that will take place if the methane in the atmosphere was suddenly multiplied by 11.

Whiteman et al. recently calculated that such an event would cause $60 trillion in damage. By comparison, the size of the world economy in 2012 was about $70 trillion.

Shallow waters in the Arctic Ocean
Shallow waters and little hydroxyl

The danger is particularly high in the shallow seas that are so prominent in the Arctic Ocean, as illustrated by the light blue areas on the image on the right, from an earlier post.

Much of the waters in the Arctic Ocean are less than 50 m deep. Being shallow makes waters prone to warm up quickly during summer temperature peaks, allowing heat to penetrate the seabed.

This can destabilize hydrates and methane rising through shallow waters will then also enter the atmosphere more quickly, as it rises abruptly and in plumes.

Elsewhere in the world, releases from hydrates underneath the seafloor will largely be oxidized by methanotroph bacteria in the water and where methane does enter the atmosphere, it will quickly be oxidized by hydroxyl. In shallow waters, however, methane released from the seabed will quickly pass through the water column.

Large abrupt releases will also quickly deplete the oxygen in the water, making it harder for bacteria to break down the methane.

Very little hydroxyl is present in the atmosphere over the poles, as illustrated by the image on the right, showing global hydroxyl levels, from an earlier post.

In case of a large abrupt methane release from the Arctic Ocean, the little hydroxyl that is present in the atmosphere over the Arctic will therefore be quickly depleted, and the methane will hang around for much longer locally than elsewhere on Earth.

Shallow waters make the Arctic Ocean more prone to methane releases, while low hydroxyl levels make that methane that enters the atmosphere in the Arctic will contribute significantly to local warming and threaten to trigger further methane releases.

High levels of insolation in summer in the Arctic

Furthermore, the amount of solar radiation received by the Arctic at the June Solstice is higher than anywhere else on Earth, as illustrated by the image below, showing insolation on the Northern Hemisphere by month and latitude, in Watt per square meter, from an earlier post.

Warm water enters Arctic Ocean from Atlantic and Pacific Oceans

What further makes the situation in the Arctic particularly dangerous is that waters are not merely warmed up from the top down by sunlight that is especially strong over the Arctic Ocean in summer on the Northern Hemisphere, but also by warm water that flows into the Arctic Ocean from rivers and by warm water that enters the Arctic Ocean through the Bering Strait and through the North Atlantic Ocean. The latter danger is illustrated by the image below, from an earlier post.


Feedbacks

Furthermore, there are feedbacks that can rapidly accelerate warming in the Arctic, such as albedo losses due to loss of sea ice and snow cover on land, and changes to the jet stream resulting in more extreme weather. These feedbacks, described in more details at this page, are depicted in the image below.


Methane


Above image shows that methane levels on December 3, 2015, were as high as 2445 parts per billion (ppb) at 469 millibars, which corresponds to an altitude of 19,810 feet or 6,041 m.

The solid magenta-colored areas (levels over 1950 ppb) that show up over a large part of the Arctic Ocean indicate very strong methane releases.

Note there are many grey areas on above image. These are areas where no measurements could be taken, which is likely due to the strength of winds, rain, clouds and the jet stream, as also illustrated by the more recent (December 5, 2015) images on the right.

The polar jet stream on the Northern Hemisphere shows great strength, with speeds as high as 243 mph or 391 km/h (over a location over japan marked by green circle) on December 5, 2015.

So, high methane levels may well have been present in these grey areas, but didn't show up due to the weather conditions of the moment.

Furthermore, the white geometric areas are due the way the satellite takes measurements, resulting in areas that are not covered.

Finally, it should be noted that much of the methane will have been broken down in the water, before entering the atmosphere, so what shows up in the atmosphere over the Arctic is only part of the total amount of methane that is released from the seafloor.

In conclusion, the high methane levels showing up over the Arctic indicate strong methane releases from the seafloor due to warm waters destabilizing sediments that contain huge amounts of methane in the form of free gas and hydrates.

Climate Plan

As global warming continues, the risk increases that greater ocean heat will reach the Arctic Ocean and will cause methane to be released in large quantities from the Arctic Ocean seafloor. The 2015 El Niño has shown that a huge amounts of ocean heat can accumulate at a depth greater than 100 m (328 ft). Conditions in the Arctic and feedbacks make that methane threatens to be released there abruptly and in large quantities as warming continues.

The situation is dire and calls for comprehensive and effective action as described at the Climate Plan. 


On November 24, 2015, equatorial waters at ≈100 m (328 ft) depth at 110-135°W were over 6°C (10.8°F) warmer than average...
Posted by Sam Carana on Friday, December 4, 2015

Ocean Heat

...
Sea Surface Temperatures

Sea surface temperatures were as high as 15.8°C or 60.4°F near Svalbard on November 7, 2015, a 13.7°C or 24.7°F anomaly. Let this sink in for a moment. The water used to be close to freezing point near Svalbard around this time of year, and the water now is warmer by as much as 13.7°C or 24.7°F.

[ click on image to enlarge ]
Above image further shows that sea surface temperature anomalies as high as 6.7°C or 12.1°F were recorded on November 7, 2015, off the coast of North America, while anomalies as high as 6°C or 10.9°F were recorded in the Bering Strait.

NOAA analysis shows that the global sea surface in September 2015 was the warmest on record, at 0.81°C (1.46°F) above the 20th century average of 16.2°C (61.1°F). On the Northern Hemisphere, the anomaly was 1.07°C (1.93°F).

[ click on image to enlarge ]

How did temperatures get so high near Svalbard? The answer is that ocean currents are moving warm water from the Atlantic Ocean into the Arctic Ocean. The ocean is warmer underneath the sea surface and at that location near Svalbard warm water from below the surface emerges at the surface.

Ocean Heat

The oceans are warming up rapidly, especially the waters below the sea surface. Of all the excess heat resulting from people's emissions, 93.4% goes into oceans. Accordingly, the temperature of oceans has risen substantially over the years and - without action - the situation only looks set to get worse.

NOAA's ocean heat content figures for 0-2000 m are very worrying, as illustrated by the image below.


The image below was created with data for January through to March, while adding non-linear trendlines for ocean heat at depths of 0-700 m and 0-2000 m. For growth of ocean heat content for 0-700 m, a polynomial trend is added, while for growth of ocean heat content for 0-2000 m an exponential trend is added.

[ click on images to enlarge ]
The image below shows a polynomial trend based on all available quarterly data for ocean heat content from 0 to 2000 m. The trendline shows even faster growth.


The danger is that, as ocean heat continues to grow, ocean currents will keep carrying ever warmer water from the Atlantic and Pacific Oceans into the Arctic Ocean.

Merely watching temperatures at the surface of the ocean may underestimate the warming that is taking place below the sea surface. At the sea surface, evaporation takes place that cools the water. Furthermore, melting of sea ice and glaciers will make that a layer of cold freshwater spreads at the surface, preventing much transfer of heat from the ocean to the atmosphere, as discussed at this earlier post. The blue-colored areas on the Northern Hemisphere on the top image are partly the result of this meltwater. There is another reason why these areas are relatively cool, i.e. sulfates, as further discussed in the section below.

Aerosols

Particulates, in particular sulfate, can provide short-term cooling of the sea surface. Large amounts of sulfate are emitted from industrial areas in the east of North America and in East Asia. On the Northern Hemisphere, the Coriolis effect makes that such emissions will typically reach areas over the nearby ocean to the east of such industrial areas, resulting in the sea surface there being cooled substantially, until the particulates have fallen out of the sky. Since the sulfate is emitted on an ongoing basis, the cooling effect continues without much interruption.

[ click on image to enlarge ]
This sulfate has a cooling effect on areas of the sea surface where ocean currents are moving warm water toward the Arctic Ocean. Because the sea surface gets colder, there is less evaporation, and thus less heat transfer from the ocean to the atmosphere during the time it takes for the water to reach the Arctic Ocean. As a result, water below the sea surface remains warmer as it moves toward the Arctic Ocean.


Similarly, as illustrated by above image, sulfur dioxide emitted in industrial areas in North America and East Asia can extend over the oceans, cooling the surface water of currents that are moving water toward the Arctic Ocean.

Methane

The image below shows that atmospheric methane levels in 2014 were 1833 parts per billion (WMO data) or 254% the pre-industrial level. WMO data are for 1984-2014 and are marked in red, while IPCC data (AR5) are for the years 1755-2011 and are marked in blue.


The image below shows the rise of methane levels from 1984 created with World Metereological Organization (WMO) data. The square marks a high mean 2015 level, from NOAA's MetOp-2 satellite images, and it is added for comparison, so it does not influence the trendline, yet it does illustrate the direction of rise of methane levels and the threat that global mean methane levels will double well before the year 2040.


The image below illustrates the danger that large amounts of methane will erupt from the Arctic Ocean, particularly in East Siberian Arctic Shelf, where the sea is quite shallow, so much of the methane can reach the atmosphere without being broken down by microbes on the way up through the water column.


The video below shows how methane concentrations start to rise close to sea level, and how concentrations strengthen at higher altitudes, and to eventually get lower at even higher altitudes.


The Threat

Ocean heat threatens to increasingly reach the seafloor of the Arctic Ocean and unleash huge methane eruptions from destabilizing clathrates. Such large methane eruptions will then warm the atmosphere at first in hotspots over the Arctic and eventually around the globe, while also causing huge temperature swings and extreme weather events, contributing to increasing depletion of fresh water and food supply, as further illustrated by the image below, from an earlier post.

[ click on image at original post to enlarge ]

The image below gives an indication of the ocean heat that is pushed by the Gulf Stream toward the Arctic Ocean. Note that this image shows the situation on November 15, 2015. Water off the east coast of North America is even warmer at the peak of the Northern Hemisphere summer and it is this water that is now arriving in the Arctic Ocean.


Below is a radio version of this post, roughly as read by Debba Kale Earnshaw at this episode and the next episode of extinctionradio.org


Malcolm Light comments:
To a geologist-oceanographer, the increasing rate of heat gain in the deep water seems obvious. Massive quantities of heat are generated in the earth's interior by radioactivity and find their way to the surface in rising convection systems to erupt along mid-ocean ridges as basaltic lava flows, pushing the plates apart. Under normal circumstances, prior to the arrival of civilized man, the plates cooled as they expanded by passing their heat into the oceans, which then was radiated into space.

Now, with the fast evolving atmospheric greenhouse Arctic methane global warming veil. the heat is simply being reflected back into the oceans and onto the land. Therefore, just like a pressure cooker, the Earth's interior heat is becoming trapped more and more and of course the end result will be a final blow-out. The more than 400 thousand years of ice core data show that we can expect a massive atmospheric methane peak caused by destabilization of the Arctic subsea methane hydrates very soon (8 to 16 years away) and it will produce a Permian style extinction event with a temperature increase of some 8 to 10 degrees C.


Climate Plan

The situation is dire and calls for comprehensive and effective action, as discussed at the Climate Plan.

Sea surface temperatures were as high as 15.8°C or 60.4°F near Svalbard on November 7, 2015, a 13.7°C or 24.7°F anomaly....
Posted by Sam Carana on Monday, November 9, 2015