Showing posts with label hydrates. Show all posts

Less sea ice, warmer Arctic Ocean

...
On November 2, 2016, Arctic sea ice extent was at a record low for the time of the year, i.e. only 7.151 million km².
The currently very low sea ice extent is further dragging down the average annual sea ice extent, which is also at a record low, as illustrated by the image below, from the blog by Torstein Viðdalr.


Not only is Arctic sea ice extent very low, the sea ice is getting thinner and thinner, as illustrated by the image below, by Wipneus, showing the dramatic recent decline of Arctic sea ice thickness.
As the Naval Research Lab 30-day animation below shows, Arctic sea ice isn't getting much thicker, despite the change of seasons.

Naval Research Lab 30-day animation (new model) up to Nov 1, 2016, with forecast up to Nov 9, 2016
In the two videos below, Paul Beckwith further explains the situation.


Paul Beckwith: "Arctic sea ice regrowth is eff'd this year, in fact is truly horrible. As the ice extent, defined as regions with at least 15% ice, tries to expand via sea water freezing, it is melted out by extremely high sea surface temperatures. Then the cooled surface water mixes via wave action with warmer water down to as much as 200 meters and the warm mixtures at the surface continue the process of sea ice melting. Without strong ice regrowth, we will reach the state we are heading to. Namely, zero sea ice. We must break this vicious cycle, by declaring a global climate emergency, and implementing the three-legged-stool solution set."


As global warming raises the temperature of the sea surface and the atmosphere over the sea surface, ever stronger winds develop, in turn resulting in stronger waves and higher amounts of water in clouds.

The image below shows forecasts for November 9, 2016, of waves as high as 13.76 m (green circle, left panel) and of total amounts of water (from surface to space) as much as 1.38 kg/m² (green circle right panel, near Novaya Zemlya).

[ click on images to enlarge ]
High waves make it hard for sea ice to form, while evaporation from the ocean adds more water vapor to the atmosphere. Since water vapor is a potent greenhouse gas, this further accelerates warming of the Arctic.

The dire state of the sea ice indicates that the water of the Arctic Ocean is getting warmer and warmer.


On October 31, 2016, the Arctic Ocean was as warm as 17°C or 62.7°F (green circle near Svalbard), or 13.9°C or 25°F warmer than 1981-2011. This indicates how much warmer the water is beneath the surface, as it arrives in the Arctic Ocean from the Atlantic Ocean.

The danger is that, as global warming continues and as the Arctic snow and ice cover keeps shrinking, warming of the Arctic Ocean will speed up and destabilize methane hydrates contained in sediments at its seafloor, triggering huge methane eruptions that will further accelerate warming. This could contribute to make global temperature rise by as much as 10°C or 18°F over the coming decade.

The situation is dire and calls for comprehensive and effective action, as described in the Climate Plan.


Blue Ocean Event September 2017?

...
Will there be a Blue Ocean Event in September 2017, during which the Arctic Ocean will be virtually ice-free? What would be the significance of such an event?

The Arctic Ocean is about to become virtually ice-free, perhaps as early as next year. At first, this Blue Ocean Event may last for one or more days in September 2017. Over the years, the ice-free period will grow longer and longer, if no action is taken.

Projections of an ice-free Arctic Ocean have been made for years. What makes the prospect of a Blue Ocean Event so dire?

Disappearance of the sea ice means that a huge amount of sunlight that was previously reflected back into space, is instead getting absorbed by the Arctic. The reason for this is that sea ice is more reflective than the water of the Arctic Ocean. The situation on land in the Arctic is similar, i.e. the snow and ice cover on land is more reflective than the darker soil and rocks that get uncovered as the snow and ice disappears. So, extra heat gets added and this is accelerating warming in the Arctic. On land, extra heat will also warm up water of rivers, and a lot of this heat will end up in the Arctic Ocean.

Another feedback is water vapor, as highlighted in the diagram below.


A warmer atmosphere carries more water vapor. Since water vapor is a potent greenhouse gas, this further accelerates warming over the Arctic.


As above image shows, temperatures have been more than 2.5°C warmer than 1981-2010 over most of the Arctic Ocean over the past 365 days (up to October 7, 2016). Accelerated Arctic warming has been taking place for a long time. So, what is it that makes a Blue Ocean Event, a virtually ice-free Arctic Ocean, such a big thing?

It is a huge event, because once the sea ice is gone, warming of the Arctic Ocean is likely to speed up even more dramatically. Why? Because having no more sea ice means that the buffer is gone. In the past, thick sea ice extended meters below the sea surface, in many parts of the Arctic Ocean. Melting of this ice into water did consume massive amounts of ocean heat. As such, thick sea ice acted as a buffer. Over the years, Arctic sea ice has become thinner and thinner, as illustrated by the image below.

[ click on image to enlarge ]
Over the past few years, trends have been pointing at zero thickness soon, i.e. in a matter of years. Added below is a trend produced by Arctische Pinguin, pointing at zero volume sea ice in the year 2021.
[ click on image to enlarge ]
Note that there is some variability from year to year. This indicates that a Blue Ocean Event may well happen earlier than the trend, e.g. in September 2017. The image further shows that there's hardly any buffer left, the buffer is virtually gone!

This buffer used to consume massive amounts of ocean heat that is carried along sea currents into the Arctic Ocean. Once the sea ice is gone, that heat must go somewhere else. A huge amount of energy used to be absorbed by this buffer, i.e. by melting ice and transforming it into water. The energy that used to be absorbed by melting ice is as much as it takes to warm up an equivalent mass of water from zero °C to 80 °C. Much of this heat will then suddenly speed up warming of the water of the Arctic Ocean, rather than going into melting the ice as it did previously. So, the water of the Arctic Ocean will suddenly warm up dramatically. Remember that the Arctic Ocean in many areas is very shallow, in many places it's less than 50 m deep, as discussed in an earlier post.

The Buffer has gone, feedback #14 on the Feedbacks page
The danger is that this extra heat will reach the seafloor and destabilize methane hydrates that are contained in sediments at the bottom of the Arctic Ocean. This could result in huge methane eruptions. It is hard for methane plumes to get broken down in the water, given the abrupt and concentrated nature of such releases and given that the Arctic Ocean is in so many places very shallow. Once that methane enters the atmosphere, it will strongly contribute to further warming of the atmosphere over the Arctic.


In conclusion, disappearance of the sea ice would mean that the buffer has gone. This further increases the danger of huge abrupt releases of methane from the seafloor of the Arctic Ocean. In many respects, the danger is such that we can just count ourselves lucky that such huge releases haven't occurred yet.

In response to this danger, comprehensive and effective action is needed, along multiple lines of action, each implemented in parallel and simultaneously. While local feebates are typically the most effective policies, local communities can each decide what works best for them, provided that agreed targets are met, and such targets will need to be a lot stronger and more comprehensive than the aspirational emission reductions that countries have submitted as part of the Paris Agreement.

The situation is dire and calls for comprehensive and effective action, as described in the Climate Plan.


Above post was also read by David Petraitis as part of the podcast by Wolfgang Werminghausen


The Threat Of Arctic Albedo Change

...
Arctic sea ice extent in 2016 was the lowest since satellite measurements started, when extent is averaged over the period from March 20 to September 22, as illustrated by the image below.


As the added trend also illustrates, this decline in Arctic sea ice extent looks set to further accelerate and result in a dramatic fall in albedo. The trend points at zero sea ice over this entire period in less than two decades from now.

Zero sea ice on a single day looks set to occur much earlier; a similar trend points at minimum sea ice extent reaching zero in about a decade from now, as illustrated by the image below.

Above image also shows average sea ice extent data for the period January 1 to September 22, i.e. the year to date (blue line). The added trend points at zero being reached in 2037. The data show that Arctic sea ice extent also was the lowest since satellite measurements started, when extent is averaged over the period from January 1 to September 22.

Finally, the image also shows data for the average sea ice extent over the entire year. Data for 2016 are not available yet, but it does look like 2016 will also be have the lowest sea ice extent when averaged over the entire year.

Anyway, the period between the equinoxes of March 20 and September 22/23 is most important, as the Arctic receives most sunlight during this period. This is illustrated by the image on the right and by he image below, from an earlier post, which further shows that the amount of solar radiation received by the Arctic at the time of the June Solstice is higher than anywhere else on Earth.


Thick sea ice covered with snow can reflect as much as 90% of the incoming solar radiation. After the snow begins to melt, and because shallow melt ponds have an albedo (or reflectivity) of approximately 0.2 to 0.4, the surface albedo drops to about 0.75. As melt ponds grow and deepen, the surface albedo can drop to 0.15, while the ocean reflects only 6% of the incoming solar radiation and absorbs the rest.


As Professor Peter Wadhams, University of Cambridge, once calculated, a collapse of the sea ice would go hand in hand with dramatic loss of snow and ice cover on land in the Arctic. The albedo change resulting from the snowline retreat on land is similarly large as the retreat of sea ice, so the combined impact could be well over 2 W/sq m. To put this in context, albedo changes in the Arctic alone could more than double the net radiative forcing resulting from the emissions caused by all people of the world, estimated by the IPCC to be 1.6 W/sq m in 2007 and 2.29 W/sq m in 2013.

Professor Peter Wadhams on albedo changes in the Arctic
Collapse of the sea ice could occur even faster than decline of sea ice extent may indicate.

Rapid loss of sea ice thickness has taken place over the years, as discussed in a recent post. A trend based on PIOMAS volume data (preliminary for 2016) points at a collapse around December 2021/January 2022, as illustrated by the graph below.

Indeed, Professor Peter Wadhams warned about this in 2012: "global warming will increase the intensity of extreme weather events, so more heavy winds and more intense storms can be expected to increasingly break up the remaining ice, both mechanically and by enhancing ocean heat transfer to the under-ice surface."

Thin sea ice is more vulnerable to the stronger storms that can be expected to hit the Arctic Ocean during the northern summer more frequently, and they could push huge amounts of ice out of the Arctic Ocean.


The sea ice acts as a heat buffer by absorbing energy in the process of melting. In other words, as long as there is sea ice, it will absorb heat and this will prevent this heat from raising the temperature of the water in the Arctic. Once the sea ice is gone, this latent heat must go elsewhere.

As the sea ice heats up, 2.06 J/g of heat goes into every degree Celsius that the temperature of the ice rises. While the ice is melting, all energy (at 334J/g) goes into changing ice into water and the temperature remains at 0°C (273.15K, 32°F).

Once all ice has turned into water, all subsequent heat goes into heating up the water, at 4.18 J/g for every degree Celsius that the temperature of water rises.

The amount of energy absorbed by melting ice is as much as it takes to heat an equivalent mass of water from zero to 80°C. The energy required to melt a volume of ice can raise the temperature of the same volume of rock by 150º C.
This buffer is now largely gone and further decline of Arctic sea ice means that a lot more heat will be absorbed by the Arctic.

As the water of the Arctic Ocean keeps warming, the risk increases that methane hydrates at the bottom of the Arctic Ocean will destabilize. Increases in temperature due to albedo changes and methane releases in the Arctic will go hand in hand with further feedbacks, in particular increased levels of water vapor in the atmosphere.

Here's the danger: As decline of the snow and ice cover in the Arctic continues and as more methane gets released from the seafloor, temperatures will rise rapidly, triggering further feedbacks such as a rise of water vapor in the atmosphere. Keep in mind that what makes heat unbearable is a combination of high temperatures with high humidity levels. Furthermore, water vapor is a potent greenhouse gas that will further accelerate the temperature rise. Taken together, we are facing the possibility of a 10°C temperature rise within one decade.

The image below, from the extinction page, shows that we may well be on a trend that is rising even faster than the rapid temperature increases in 2016 may indicate. Indeed, a large part of global warming is currently masked by aerosols and, as we make progress with the necessary shift to clean energy, the full wrath of global warming looks set to become manifest soon.


Risk is the product of probability and severity. The risk of a 10°C temperature rise is incalculably high. On the severity dimension, the impact of such a temperature rise is beyond catastrophic, i.e. we're talking about extinction of species at massive scale, including humans. On the probability dimension, this outcome appears to be inevitable if no comprehensive and effective action is taken.


Above danger assessment adds a third dimension, i.e. timescale. A 10°C temperature rise could eventuate within one decade and this also makes the danger imminent, adding further weight to the need to start taking comprehensive and effective action, as described in the Climate Plan.


High Methane Levels Follow Earthquake in Arctic Ocean

...
In the 12 months up to July 14, 2016, 48 earthquakes with a magnitude of 4 or higher on the Richter scale hit the map area of the image below, mostly at a depth of 10 km (6.214 miles).


As temperatures keep rising and as melting of glaciers keeps taking away weight from the surface of Greenland, isostatic rebound can increasingly trigger earthquakes around Greenland, and in particular on the faultline that crosses the Arctic Ocean.

Two earthquakes recently hit the Arctic Ocean. One earthquake hit with a magnitude of 4.5 on the Richter scale on July 9, 2016. The other earthquake hit with a magnitude of 4.7 on the Richter scale on July 12, 2016, at 00:15:24 UTC, with the epicenter at 81.626°N 2.315°W and at a depth of 10.0 km (6.214 miles), as illustrated by the image below.


Following that most recent earthquake, high levels of methane showed up in the atmosphere on July 15, 2016, over that very area where the earthquake hit, as illustrated by the image below.


Above image shows that methane levels were as high as 2505 ppb at an altitude of 4,116 m or 13,504 ft on the morning of July 15, 2016. At a higher altitude (of 6,041 m or 19,820 ft), methane levels as high as 2598 ppb were recorded that morning and the magenta-colored area east of the north-east point of Greenland (inset) looks much the same on the images in between those altitudes. All this indicates that the earthquake did cause destabilization of methane hydrates contained in sediments in that area.

Above image, from another satellite, confirms strong methane releases east of Greenland on the afternoon of July 14, 2016, while the image below shows high methane levels on July 16, 2016, along the faultline that crosses the Arctic Ocean.


The image on the right shows glaciers on Greenland and sea ice near Greenland and Svalbard on July 15, 2016. Note that clouds partly obscure the extent of the sea ice decline.


Above image shows the sea ice on July 12, 2016. There is a large area with very little sea ice close to the North Pole (left) and there is little or no sea ice around Franz Josef Land (right). Overall, sea ice looks slushy and fractured into tiny thin pieces. All this is an indication how warm the water is underneath the sea ice.

[ click on image to enlarge ]
In addition to the shocks and pressure changes caused by earthquakes, methane hydrate destabilization can be triggered by ocean heat reaching the seafloor of the Arctic Ocean. Once methane reaches the atmosphere, it can very rapidly raise local temperatures, further aggravating the situation.

Temperatures are already very high across the Arctic, as illustrated by the image below, showing that on July 16, 2016, it was 1.6°C or 34.8°F over the North Pole (top green circle), while it was 32.7°C or 90.8°F at a location close to where the Mackenzie River flows into the Arctic Ocean (bottom green circle).

Arctic sea ice is in a very bad shape, as also illustrated by the Naval Research Laboratory nowcast below.


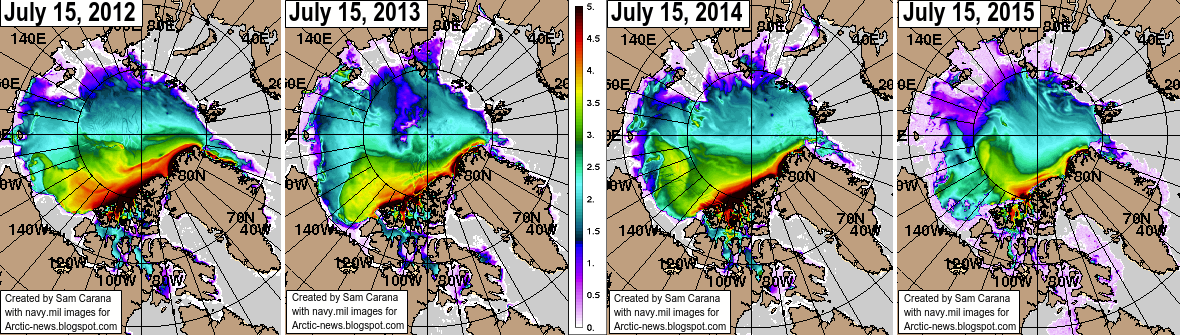
Sea ice thickness has fallen dramatically over the years, especially the ice that was more than 2.5 m thick. The image below compares the Arctic sea ice thickness (in m) on July 15, for the years from 2012 (left panel) to 2015 (right panel), using Naval Research Laboratory images.

[ Click on image to enlarge ]
The image below shows sea surface temperature anomalies from 1961-1990 on July 24, 2016.


Sea surface temperatures off the coast of America are high and much of this ocean heat will be carried by the Gulf Stream toward the Arctic Ocean over the next few months.


On July 24, 2016, sea surface temperature near Florida was as high as 33.2°C or 91.7°F, an anomaly of 3.7°C or 6.6°F from 1981-2011 (bottom green circle), while sea surface temperature near Svalbard was as high as 17.3°C or 63.2°F, an anomaly of 12.6°C or 22.8°F from 1981-2011 (top green circle).

A cold freshwater (i.e. low salinity) lid sits on top of the ocean and this lid is fed by precipitation (rain, hail, snow, etc.), melting sea ice (and icebergs) and water running off the land (from rivers and melting glaciers on land). This lid reduces heat transfer from ocean to atmosphere, and thus contributes to a warmer North Atlantic where huge amounts of heat are now carried underneath this lid toward the Arctic Ocean. The danger is that more ocean heat arriving in the Arctic Ocean will destabilize clathrates at the seafloor and result in huge methane eruptions, as discussed in earlier posts such as this one.

As temperatures keep rising, snow and ice in the Arctic will decline. This could result in some 1.6°C or 2.88°F of warming due to albedo changes (i.e. due to decline both of Arctic sea ice and of snow and ice cover on land). Additionally, some 1.1°C or 2°F of warming could result from methane releases from clathrates at the seafloor of the world's oceans. As discussed in an earlier post, this could eventuate as part of a rise from pre-industrial levels of as much as 10°C or 18°F, by the year 2026.

[ click on image to enlarge ]


The impact of rising temperatures will be felt firstly and most strongly in the Arctic, where global warming is accelerating due to numerous feedbacks that can act as self-reinforcing cycles.

Already now, this is sparking wildfires across the Arctic.

Above image shows wildfires (indicated by the red dots) in Alaska and north Canada, on July 15, 2016.

The image on the right shows smoke arising from wildfires on Siberia. The image below shows that, on July 18, 2016, levels of carbon monoxide (CO) over Siberia were as high as 32318 ppb, and in an area with carbon dioxide (CO2) levels as low as 345 ppm, CO2 reached levels as high as 650 ppm on that day.

[ click on images to enlarge them ]
The image below shows the extent of smoke from wildfires in Siberia on July 23, 2016.


The image below shows high methane levels over Siberia on July 19, 2016.


The image below, from the MetOp satellite, shows high methane levels over Siberia on July 21, 2016.

Below are further images depicting mean global methane levels, from 1980-2016 (left) and 2012-2016 (right).

The image below shows methane levels at Barrow, Alaska.


The image below shows that, while methane levels may appear to have remained stable over the past year when taking measurements at ground level, at higher altitudes they have risen strongly.


The conversion table below shows the altitude equivalents in feet, m and mb.
57016 feet44690 feet36850 feet30570 feet25544 feet19820 feet14385 feet 8368 feet1916 feet
17378 m13621 m11232 m 9318 m 7786 m 6041 m 4384 m 2551 m 584 m
 74 mb 147 mb 218 mb 293 mb 367 mb 469 mb 586 mb 742 mb 945 mb

The situation is dire and calls for comprehensive and effective action, as described at the Climate Plan.


High Temperatures In Arctic

...
0-2000 m Global Ocean Heat Content
Ocean heat content is rising, as illustrated by the image on the right. Where the sea ice declines, this is causing high air temperatures in the Arctic.

This year (from January to April 2016) on the Northern Hemisphere, oceans were 0.85°C or 1.53°F warmer than the 20th century average.

The image below illustrates that temperatures look set to be high in Siberia for the coming week. The panel on the right shows anomalies at the top end of the scale in Eastern Siberia on June 5, 2016, while the panel on the right shows a forecast for June 12, 2016.


These high air temperatures are causing feedbacks that are in turn further speeding up warming in the Arctic.

Warmer Rivers

Temperatures as high as 28.9°C or 83.9°F were recorded over the Mackenzie River close to the Arctic Ocean on June 13, 2016, at location marked by the green circle.


Below is a satellite image of the Mackenzie River delta on June 11, 2016


The image below shows that temperatures as high as 36.6°C or 97.8°F were forecast for June 13, 2016, over the Yenisei River in Siberia that ends in the Arctic Ocean.


Wildfires

Earlier this month, temperatures in Eastern Siberia were as high as 29.5°C (85°F). This was on June 5, 2016, at a location close to the coast of the Arctic Ocean (green circle).


High air temperatures come with increased risk of wildfires, as illustrated by the image below showing carbon monoxide levels as high as 2944 ppb on June 4, 2016 (at green circle).


The satellite image below zooms into the area with these high carbon monoxide readings, showing wildfires on Kamchatka Peninsula on June 3, 2016.


Albedo Loss

The image on the right shows that, this year, April snow cover on the Northern Hemisphere was the lowest on record. The added trend points at a total absence of snow by the year 2036.

Professor Peter Wadhams, head of the Polar Ocean Physics Group at Cambridge University, says: “My prediction remains that the Arctic ice may well disappear, that is, have an area of less than one million square kilometres for September of this year.”

Warming due to Arctic snow and ice loss may well exceed 2 W per square meter, i.e. it could more than double the net warming now caused by all emissions by people of the world, Peter Wadhams calculated in 2012.

Seafloor Methane

Peter Wadhams further co-authored a study that calculated that methane release from the seafloor of the Arctic Ocean could yield 0.6°C warming of the planet in 5 years (see video interview of Thom Hartmann with Peter Wadhams below).


Combined Impact Of Multiple Feebacks

In conclusion, high air temperatures in the Arctic are very worrying, as they can trigger a number of important feedbacks, i.e. the ones discussed above and further feedbacks such as:
  • Changes to Jet Streams. As the Arctic warms more rapidly than the rest of Earth, changes are occurring to the jet streams. As a result, winds can increasingly bring hot air far to the north, resulting in further loss of the Arctic snow and ice cover, in turn further warming up the Arctic.
  • Warmer Rivers. High air temperatures cause warming of the water of rivers that end up in the Arctic Ocean, thus resulting in additional sea ice decline and warming of the Arctic Ocean all the way down to the seabed.
  • Wildfires. High air temperatures set the scene for wildfires that emit not only greenhouse gases such as carbon dioxide and methane, but also pollutants such as carbon monoxide that depletes hydroxyl that could otherwise break down methane, and black carbon that, when settling on ice, causes it to absorb more sunlight (see under albedo loss), besides being a climate forcer when in the atmosphere.
  • Soil destabilization. Heatwaves and droughts destabilize the soil. Soil that was previously known as permafrost, was until now held together by ice. As the ice melts, organic material in the soil starts decomposing, resulting in emissions of methane and carbon dioxide, while the soil becomes increasingly vulnerable to wildfires.
  • Buffer Loss. Arctic snow and ice cover acts as a buffer, absorbing heat that in the absence of this buffer will have to be absorbed by the Arctic Ocean, as discussed in earlier posts such as this one. 
  • Albedo Loss. Arctic snow and ice cover make that sunlight is reflected back into space. In the absence of this cover, the Arctic will have to absorb more heat.
  • Seafloor Methane. As sediments at the seafloor of the Arctic Ocean warm, hydrates contained in these sediments could be destabilized and release huge quantities of methane.

How much warmer could it be within one decade?

The two feedbacks mentioned by Peter Wadham (albedo and seafloor methane) are are depicted in the image below.

for further discussion, see the feedbacks page
The combined global temperature rise over the next decade due to these two feedbacks (albedo and seafloor methane) alone may be 0.4°C or 0.72°F for a low-rise scenario and may be 2.7°C or 4.9°F for a high-rise scenario.

Additionally, as temperatures rise, further feedbacks will kick in more strongly, further accelerating the rise in temperature, as also discussed in earlier posts such as this one.

When also including further feedbacks, warming could exceed 10°C (18°F) within one decade, assuming that no geoengineering will take place within a decade, as discussed in earlier posts such as this one.

The situation is dire and calls for comprehensive and effective action, as described at the Climate Plan.

Links

- Feedbacks in the Arctic
http://arctic-news.blogspot.com/p/feedbacks.html

- East Siberian Heatwave
http://arctic-news.blogspot.com/2015/07/east-siberian-heat-wave.html

- Wildfire Danger Increasing
http://arctic-news.blogspot.com/2016/05/wildfire-danger-increasing.html

- Albedo changes in the Arctic
http://arctic-news.blogspot.com/2012/07/albedo-change-in-arctic.html

- Three kinds of warming in the Arctic
http://arctic-news.blogspot.com/2016/02/three-kinds-of-warming-in-arctic.html

- Arctic could become ice-free for first time in more than 100,000 years, claims leading scientist
http://www.independent.co.uk/environment/climate-change/arctic-could-become-ice-free-for-first-time-in-more-than-100000-years-claims-leading-scientist-a7065781.html

- Greenhouse gas levels and temperatures keep rising
http://arctic-news.blogspot.com/2016/01/greenhouse-gas-levels-and-temperatures-keep-rising.html

- Arctic Methane Release: "Economic Time Bomb"
http://arctic-news.blogspot.com/2013/07/arctic-methane-release-economic-time-bomb.html

- February Temperature
http://arctic-news.blogspot.com/2016/03/february-temperature.html

- September 2015 Sea Surface Warmest On Record