Showing posts with label wildfires. Show all posts

Wildfires in Russia's Far East

...
Wildfires can add huge amounts of carbon dioxide (CO2), carbon monoxide (CO), methane (CH4), nitrous oxide (N2O) and black carbon (BC or soot) into the atmosphere.

While CO and soot are not included as greenhouse gases by the IPCC, they can have strong warming impact. CO acts as a scavanger of hydroxyl, thus extending the lifetime of methane. BC results from biomass burning, which a study by Mark Jacobson found to cause 20 year global warming of ~0.4 K. Moreover, BC has a darkening effect when settling on snow and ice, making that less sunlight gets reflected back into space, which accelerates warming. This hits the Arctic particularly hard during the Northern Summer, given the high insolation at high latitudes at that time of year.

The image below shows fires around the globe on August 12, 2016.


Visible in the top right corner of above image are wildfires in Russia's Far East. The image below zooms in on these wildfires.


The image below shows carbon dioxide levels as high as 713 ppm and carbon monoxide levels as high as 32,757 ppb on August 12, 2016, at the location marked by the green circle, i.e. the location of the wildfires in Russia's Far East.


As said, wildfires can also emit huge amounts of methane. The image below shows methane levels as high as 2230 ppb at 766 mb.


The magenta-colored areas on above image and the image below indicate that these high methane levels are caused by these wildfires in Russia's Far East. The image below shows methane levels as high as 2517 ppb at 586 mb.


Methane levels as high as 2533 ppb were recorded that day (at 469 mb), compared to a mean global peak of 1857 ppb that day.

Analysis by Global Fire Data found that the 2015 Indonesian fires produced more CO2e (i.e. CO2 equivalent of, in this case, CO2, CH4 and N2O) than the 2013 CO2 emissions from fossil fuel by nations such as Japan and Germany. On 26 days in August and September 2015, emissions from Indoniasian fires exceeded the average daily emissions from all U.S. economic activity, as shown by the WRI image below.


Methane emissions from wildfires can sometimes be broken down relatively quickly, especially in the tropics, due to the high levels of hydroxyl in the atmosphere there. Conversily, methane from wildfires at higher latitudes can persist much longer and will have strong warming impact, especially at higher latitudes.

Similarly, CO2 emissions from wildfires in the tropics can sometimes be partly compensated for by regrowth of vegetation after the fires. However, regrowth can be minimal in times of drought, when forests are burned to make way for other land uses or when peat is burned, and especially at higher latitudes where the growth season is short and weather conditions can be harsh. Carbon in peat lands was built up over thousands of years and even years of regrowth cannot compensate for this loss.

A recent study concludes that there is strong correlation between fire risk for South America and high sea surface temperatures in the Pacific Ocean and the Atlantic Ocean. This makes the current situation very threatening. As the image below shows, sea surface temperature anomalies were very high on August 12, 2016.

Sea surface temperature and anomaly. Anomalies from +1 to +2 degrees C are red, above that they turn yellow and white
Above image also shows that on August 12, 2016, sea surface temperatures near Svalbard (at the location marked by the green circle) were as high as 18.9°C or 65.9°F, an anomaly of 13.6°C or 24.4°F. These high temperatures threaten to melt away the Arctic's snow and ice cover, resulting in albedo changes that accelerate warming, particularly in the Arctic. Warming of the Arctic Ocean further comes with the danger that methane hydrates at its seafloor will destabilize and make that huge amounts of methane will enter the atmosphere.

The situation is dire and calls for comprehensive and effective action, as described in the Climate Plan.


Links

- Effects of biomass burning on climate, accounting for heat and moisture fluxes, black and brown carbon, and cloud absorption effects, by Mark Z. Jacobson (2014)
http://onlinelibrary.wiley.com/doi/10.1002/2014JD021861/abstract

- 2016 fire risk for South America
http://www.ess.uci.edu/~amazonfirerisk/ForecastWeb/SAMFSS2016.html

- Global Fire Data - 2015 Indonesian fires
http://www.globalfiredata.org/updates.html#2015_indonesia

- Indonesia’s Fire Outbreaks Producing More Daily Emissions than Entire US Economy (2015)
http://www.wri.org/blog/2015/10/indonesia%E2%80%99s-fire-outbreaks-producing-more-daily-emissions-entire-us-economy

- High Temperatures in the Arctichttp://arctic-news.blogspot.com/2015/06/high-temperatures-in-the-arctic.html


Climate Feebacks Start To Kick In More

...
Droughts and heatwaves are putting vegetation under devastating pressure while also causing wildfires resulting in deforestation and loss of peat at massive scale, contributing to the rapid recent rise in carbon dioxide levels. 


It will take a decade before these high recent carbon dioxide emissions will reach their full warming impact. Furthermore, as the world makes progress with the necessary cuts in greenhouse gas emissions, this will also remove aerosols that have until now masked the full wrath of global warming. By implication, without geoengineering occurring over the coming decade, temperatures will keep rising, resulting in further increases in abundance and intensity of droughts and wildfires.

Temperatures in the Arctic are rising faster than elsewhere. The image below shows that Arctic waters are now much warmer than in 2015. On June 22, 2016, sea surface near Svalbard was as warm as 13.8°C or 56.9°F (green circle), i.e. 11.6°C or 20.9°F warmer than 1981-2011.


High temperatures, as high as 34.1°C or 93.3°F at green circle, were recorded on July 1, 2016, over the Lena River which flows into the Laptev Sea, as illustrated by the image on the right [click on images to enlarge them].

Wildfires can release huge amounts of carbon dioxide (CO2), carbon monoxide (CO), methane and soot. The image below shows that on June 23, 2016, wildfires north of Lake Baikal caused emissions as high as 22,953 ppb CO and 549 ppm CO2 at the location marked by the green circle.

[ click on image to enlarge ]
The video below, created by Jim Reeve, shows an animation with carbon monoxide levels in May 2016.


As increasing amounts of soot from wildfires settle on its ice and snow cover, albedo decline in the Arctic will accelerate. In addition, heatwaves are causing rapid warming of rivers ending in the Arctic Ocean, further speeding up its warming and increasing the danger of methane releases from the seafloor of the Arctic Ocean.

As more energy stays in the biosphere, storms can be expected to strike with greater intensity. Rising temperatures will result in more water vapor in the atmosphere (7% more water vapor for every 1°C warming), further amplifying warming and resulting in more intense precipitation events, i.e. rainfall, flooding and lightning.
Record-breaking daily rainfall events around the world. From Lehmann et al. 
Recently, West Virginia got hit by devastating flooding, killing at least 26 people and causing evacuation of thousands of people and a huge amount of damage. Flooding can also cause rapid decomposition of vegetation, resulting in strong methane releases, as illustrated by the image below showing strong methane presence (magenta color) at 39,025 ft or 11.9 km on June 26 (left panel), as well as at 44,690 ft or 13.6 km on June 27 (right panel).

[ click on image to enlarge ]
Furthermore, plumes above the anvils of severe storms can bring water vapor up into the stratosphere, contributing to the formation of cirrus clouds that trap a lot of heat that would otherwise be radiated away, from Earth into space. The number of lightning strikes can be expected to increase by about 12% for every 1°C of rise in global average air temperature. At 3-8 miles hight, during the summer months, lightning activity increases NOx by as much as 90% and ozone by more than 30%.

In conclusion, feedbacks are threatening to cause runaway warming, potentially making temperatures rise by more than 10°C or 18°F within a decade. Already now, melting ice sheets are changing the way the Earth wobbles on its axis, Nasa says. As Paul Beckwith discusses in the video below, changes are also taking place to the jet streams.


The danger is that changes to the planet's wobble will trigger massive earthquakes that will destabilize methane hydrates and result in huge amounts of methane abruptly entering the atmosphere, as illustrated by the image below.

Have we lost the Arctic? It looks like Earth no longer has two poles, but instead has turned into a Monopole, with only one pole at Antarctica. On June 29, 2016, Arctic water (sea surface) was as warm as 15.8°C (60.5°F), or 13°C (23.4°F) warmer than 1981-2011. Meanwhile, surface temperatures over Antarctica that day were as low as -66.6°C (-87.8°F).
The situation is dire and calls for comprehensive and effective action as described in the Climate Plan.


Links

- Feedbacks in the Arctic
http://arctic-news.blogspot.com/p/feedbacks.html

- Wildfire Danger Increasing
http://arctic-news.blogspot.com/2016/05/wildfire-danger-increasing.html

- Arctic Climate Records Melting
http://arctic-news.blogspot.com/2016/05/arctic-climate-records-melting.html

- Ten Degrees Warmer In A Decade?
http://arctic-news.blogspot.com/2016/03/ten-degrees-warmer-in-a-decade.html

- Arctic Sea Ice gone by September 2016?
http://arctic-news.blogspot.com/2016/05/arctic-sea-ice-gone-by-september-2016.html

- February Temperature
http://arctic-news.blogspot.com/2016/03/february-temperature.html

- International Energy Agency (IEA)
http://www.iea.org/

- National Oceanic and Atmospheric Administration (NOAA)
http://www.noaa.gov/

- Projected increase in lightning strikes in the United States due to global warming, by Romps et al. (2014)
http://science.sciencemag.org/content/346/6211/851

- Impacts of anthropogenic and natural NOx sources over the U.S. on tropospheric chemistry, by Zhang et al. (2003)
http://www.pnas.org/content/100/4/1505.abstract

- Wildfires Rage in Siberia, NASA June 30, 2016, images acquired June 29, 2016
http://earthobservatory.nasa.gov/IOTD/view.php?id=88284

- Melting ice sheets changing the way the Earth wobbles on its axis, says Nasa
https://www.theguardian.com/environment/2016/apr/09/melting-ice-sheets-changing-the-way-the-earth-wobbles-on-its-axis-says-nasa

- Record-breaking heavy rainfall events increased under global warming, by Lehmann et al. (2015)
https://www.pik-potsdam.de/news/press-releases/record-breaking-heavy-rainfall-events-increased-under-global-warming

- 'Thousand-year' downpour led to deadly West Virginia floods (July 8, 2016)
https://www.climate.gov/news-features/event-tracker/thousand-year-downpour-led-deadly-west-virginia-floods


Arctic Climate Records Melting

...
An intensely warm winter and spring are melting climate records across Alaska, reports NOAA in the post 'Arctic set for record-breaking melt'. The January-April 2016 period was 11.4°F (6.4°C) warmer than the 20th century average, reports NOAA. The NOAA image below further illustrates the situation.
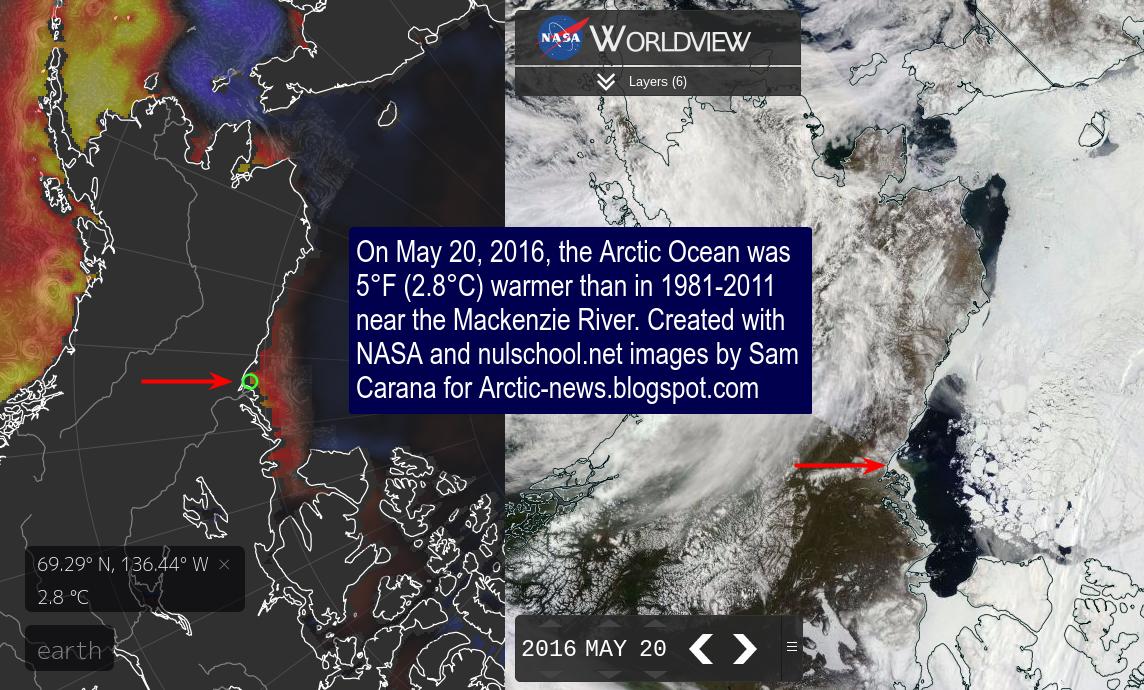
The sea ice is melting rapidly. Warm water from the Mackenzie River contributes to dramatic melting in the Beaufort Sea, as illustrated by the image below, showing that on May 20, 2016, the Arctic Ocean was 5°F (2.8°C) warmer than in 1981-2011 at the delta of the Mackenzie River.


The image below shows that on May 20, 2016, sea ice extent was 10.99 million square km, compared to the 12.05 million square km extent of the sea ice in May 20, 2012, as measured by JAXA. 


Sea ice reached a record minimum extent of 3.18 million square km on September 15, 2012, and chances are that the sea ice will be largely gone by September 2016.

The year 2016 is an El Niño year and insolation during the coming months of June and July is higher in the Arctic than anywhere else on Earth. Higher temperatures come with increased danger of wildfires. Greenhouse gases are at record high levels: in April and may, CO2 was about 408 ppm, with hourly peaks as high as 411 ppm (on May 11, 2016). Methane levels are high and rising, especially over the Arctic. Smoke and methane are speeding up sea ice melting, as illustrated by the image below showing smoke from wildfires in Canada extending over the Beaufort Sea (main image), in addition to high methane levels that are present over the Beaufort Sea (inset). 


Ocean heat is also very high and rising. Oceans on the Northern Hemisphere were 0.93°C (or 1.7°F) warmer in the most recent 12-months period (May 2015 through April 2016) than the 20th century average.

The image below shows sea ice extent as measured by the NSIDC, confirming that melting of the sea ice in 2016 is way ahead on previous years.


Here's an animation comparing sea surface temperatures of the North Atlantic between May 25, 2015, and May 25, 2016.


Arctic sea ice extent was 10.7 million km2 on May 25, 2016, 1.1 million km2 less than it was on May 25, 2012, as the update below shows.


The situation is dire and calls for comprehensive and effective action, as described in the Climate Plan.


Arctic Sea Ice Collapse Threatens

...
The image below compares the Arctic sea ice thickness on July 14, 2012 (left panel) and on July 14, 2015 (right panel), using Naval Research Laboratory images.


The Naval Research Laboratory's 30-day animation below shows how this situation developed, ending with a forecast for July 17, 2015, run on July 9, 2015.


The dramatic decline of the sea ice, especially north of North America, is the result of a combination of factors, including:

  • very high levels of greenhouse gases over the Arctic Ocean
  • very high levels of ocean heat 
  • heatwaves over North America and Siberia extending high air temperatures over the Arctic Ocean
  • wildfires triggered by these heatwaves resulting in darkening compounds settling on snow and ice
  • very warm river water running into the Arctic Ocean, as illustrated by the image below.  


With still two months of melting to go before the sea ice can be expected to reach its minimum for 2015, the threat of sea ice collapse is ominous. The Arctic-News Blog has been warning for years about the growing chance of a collapse of the sea ice, in which case huge amounts of sunlight that previously were reflected back into space, as well as heat that previously went into melting the ice, will then instead have to be absorbed by the water, resulting in a dramatic rise of sea surface temperatures.

The image below shows the already very high sea surface temperature anomalies as at July 10, 2015.


More open water will then come with an increased chance of storms that can cause high sea surface temperatures to be mixed down all the way to seafloor of the Arctic Ocean, which in many cases is less than 50 m (164 ft) deep.

Meanwhile, ocean heat is accumulating off the coast of North America, as illustrated by the image below showing sea surface temperature as high as 31.8°C (89.24°F) on July 8-9, 2015.


Massive amounts of ocean heat will be carried by the Gulf Stream into the Arctic Ocean over the next few months. The combined result of high sea surface temperatures being mixed down to the seafloor and the ocean heat entering the Arctic Ocean from the Atlantic and Pacific Oceans can be expected to result in dramatic methane eruptions from the Arctic Ocean seafloor by October 2015.

Currently, methane levels are high, especially north of Greenland, as illustrated by the image below showing that on July 10, 2015 (am), levels as high as 2416 parts per billion were recorded at 6,041 m (19,820 ft) altitude, while mean methane levels also reached 1831 parts per billion at this altitude.


The situation is dire and calls for comprehensive and effective action, as discussed at the Climate Plan.


ARCTIC SEA ICE COLLAPSE THREATENSThis image compares the Arctic sea ice thickness on July 14, 2012 (left panel) and on...
Posted by Sam Carana on Friday, July 10, 2015

Accelerated Warming in the Arctic

...

Warming in the Arctic is accelerating. On June 25, 2015, high temperatures hit North America. Temperatures as high as 30.3°C (86.54°F) were recorded where the Mackenzie River is flowing into the Arctic Ocean.

June 25, 2015 - High temperatures over North America, close to the Arctic Ocean

On July 1, 2015, temperatures are forecast to be as high as 111.4°F (or 44.1°C) near Chico, north of San Francisco. Temperatures are forecast to be high over most of North America and Eastern Siberia, threatening to further warm up waters of the Arctic Ocean.

Forecast for July 1, 2015 - High temperatures over North America, close to the Arctic Ocean

The image below shows that on June 27, 2015, temperatures of well over 40°C (104°F) were recorded in Europe and in Pakistan, where temperatures earlier this month had reached 49°C (120.2°F) in some places. The heat wave reportedly killed 1233 people in Karachi alone. This in addition to the 2500 people killed earlier in India by high temperatures.

June 27, 2015 - High temperatures over Russia, close to the Arctic Ocean
High temperatures at such locations are very worrying, for a number of reasons, including:
  • They are examples of heatwaves that can increasingly extend far to the north, all the way into the Arctic Ocean, speeding up warming of the Arctic Ocean seabed and threatening to unleash huge methane eruptions. 
  • They set the scene for wildfires that emit not only greenhouse gases such as carbon dioxide and methane, but also pollutants such as carbon monoxide (that depletes hydroxyl that could otherwise break down methane) and black carbon (that when settling on ice causes it to absorb more sunlight).
  • They cause warming of the water of rivers that end up in the Arctic Ocean, thus resulting in additional sea ice decline and warming of the Arctic Ocean seabed. 
June 24, 2015 - Smoke from wildfires in Alaska - from: wunderground.com
The image below shows increased sea surface temperature anomalies in the Arctic. Note the warming in the area of the Beaufort Sea where the Mackenzie River is flowing into the Arctic Ocean.


Very warm water is also flowing from the Pacific Ocean through the Bering Strait into the Arctic Ocean.  As the image below shows, the water that is flowing into the Arctic Ocean from the Pacific is much warmer than it used to be, as much as 6.1°C (10.98°F) warmer.

View the flow of the water on the animated version of above image at earth.nullschool.net
As said above, warm water flowing from rivers into the Arctic Ocean is a major contributor to these sea surface temperature anomalies. As also illustrated by the NOAA image below, rivers carrying warm water into the Bering Strait include the Kobuk River, the Naotak River and the Yukon River that flows all the way from British Columbia, Canada, through Alaska and ends in the Bering Strait. Sea surface temperatures near the coast of Alaska were as high as 19°C (66.2°F) from June 21-24, 2015.

Sea surface temperatures near the coast of Alaska as high as 19°C (66.2°F) from June 21-24, 2015
The Naval Research Laboratory animation below shows changes to Arctic sea ice thickness. Sea ice thickness (in m) down to zero where the Mackenzie River flows into the Arctic Ocean and in the Bering Strait where warm water from the Pacific is entering the Arctic Ocean.


The situation is dire and calls for comprehensive and effective action, as discussed at the Climate Plan.


Related

- Gulf Stream brings ever warmer water into Arctic Ocean
http://arctic-news.blogspot.com/2015/06/gulf-stream-brings-ever-warmer-water-into-arctic-ocean.html

- High Temperatures in the Arctic

- Heat Wave Forecast For Russia Early June 2015http://arctic-news.blogspot.com/2015/06/heat-wave-forecast-for-russia-early-june-2015.html

Sea surface temperature anomalies in the Arctic. Note the warming in the area of the Beaufort Sea where the Mackenzie...
Posted by Sam Carana on Thursday, June 25, 2015

Smoke Blankets North America

...

A thick layer of smoke blankets large parts of North America, as also illustrated by the animation below based on images from July 15 to 18, 2014, from Wunderground.com.

[ note that this animation is a 2.3MB file that may take some time to fully load ]
The are also extensive wildfires throughout the boreal forest and tundra zones of Central Siberia in Russia.

Such wildfires can send huge amounts of carbon dioxide, methane, soot, dust and volatile organic compounds into the atmosphere. Much of this gets deposited at higher latitudes, discoloring land, snow and ice, and thus speeding up warming by absorbing more sunlight that was previously reflected back into space.

Soils at higher latitudes can contain huge amounts of carbon in the form of peat, as described in the earlier post The Threat of Wildfires in the North. There are further conditions that make the situation in the Arctic so dangerous.
Temperature anomaly March-April-May-June 2014 (JMA)

The Arctic is particularly vulnerable to warming due to geographics. Seas in the Arctic Ocean are often shallow and covered by sea ice that is disappearing rapidly. Largely surrounded by land that is also rapidly losing its snow and ice cover, the Arctic Ocean acts like a trap capturing heat carried in by the Gulf Stream, which brings in ever warmer water. Of all the heat trapped on Earth by greenhouse gases, 90% goes into oceans, while a large part of the remaining 10% goes into melting the snow and ice cover in the Arctic, as described in an earlier post. Such basic conditions make that the Arctic is prone to warming.

Then, there are huge amounts of methane held in sediments under the Arctic Ocean, in the form of hydrates and free gas. Unlike methane releases from biological sources elsewhere on Earth, methane can be released from the seafloor of the Arctic Ocean in large quantities, in sudden eruptions that are concentrated in one area.

Until now, permafrost and the sea ice have acted as a seal, preventing heat from penetrating these methane hydrates and causing further destabilization. As long as there is ice, additional energy will go into melting the ice, and temperatures will not rise. The ice also acts as a glue, keeping the soil together and preventing hydrate destabilization from pressure changes and shockwaves resulting from seismic activity. Once the ice is gone, sediments become prone to destabilization and heat can more easily move down along fractures in the sediment, reaching hydrates that had until then remained stable.
 
Temperature anomaly March-April-May 2014 (NASA)
When methane escapes from the seafloor of the Arctic Ocean and travels through waters that are only shallow, there is little opportunity for this methane to be broken down in the water, so a lot of it will enter the atmosphere over the Arctic Ocean. The Coriolis effect will spread the methane sideways, but latitudes over the Arctic are relatively short, making the methane return at the same spot relatively quickly, while the polar jet stream acts as a barrier keeping much of the methane within the Arctic atmosphere. In case of large methane eruptions, the atmosphere over the Arctic will quickly become supersaturated with methane that has a huge initial local warming potential.

Hydroxyl levels in the atmosphere over the Arctic are very low, extending the lifetime of methane and other precursors of stratospheric ozone and water vapor, each of which have a strong short-term local warming potential. In June/July, insolation in the Arctic is higher than anywhere else on Earth, with the potential to quickly warm up shallow waters, making that heat can penetrate deep into sediments under the seafloor.

created by Sam Carana, part of AGU 2011 poster
The initial impact of this methane will be felt most severely in the Arctic itself, given the concentrated and abrupt nature of such releases, with the danger that even relatively small releases of methane from the seafloor of the Arctic can trigger further destabilization of hydrates and further methane releases, escalating into runaway warming.

This danger is depicted in the image on the right, showing how albedo changes and methane releases act as feedbacks that further accelerate warming in the Arctic, eventually spiraling into runaway global warming.

The currently very high sea surface temperature anomalies are illustrated by the two images below.


As the image below right shows, sea surface temperatures as high as 18 degrees Celsius (64.4 degrees Fahrenheit) are currently recorded in the Arctic.

Albedo changes and methane releases are only two out of numerous feedbacks that are accelerating warming in the Arctic.

Also included must be the fact that Earth is in a state of energy imbalance. Earth is receiving more heat from sunlight than it is emitting back into space. Over the past 50 years, the oceans have absorbed about 90% of the total heat added to the climate system, while the rest goes to melting sea and land ice, warming the land surface and warming and moistening the atmosphere.

In a 2005 paper, James Hansen et al. estimated that it would take 25 to 50 years for Earth’s surface temperature to reach 60% of its equilibrium response, in case there would be no further change of atmospheric composition. The authors added that the delay could be as short as ten years.

Earth's waters act as a buffer, delaying the rise in land surface temperatures that would otherwise occur, but this delay could be shortened. Much of that extra ocean heat may enter the atmosphere much sooner, e.g. as part of an El Niño event. Another buffer, Arctic sea ice, could collapse within years, as illustrated by the image below.

[ click on image to enlarge ]
The demise of sea ice comes with huge albedo changes, resulting in more heat getting absorbed by the Arctic Ocean, in turn speeding up warming of the often shallow waters of the Arctic Ocean. This threatens to make heat penetrate subsea sediments containing huge amounts of methane. Abrupt release of large amounts of methane would warm up the Arctic even more, triggering even further methane releases in a spiral of runaway warming.

Particularly worrying is the currently very warm water that is penetrating the Arctic Ocean from the Atlantic Ocean and also from the Pacific Ocean, as illustrated by the image further above and the image on the right.

The danger is that the Arctic will warm rapidly with decline of the snow and ice cover that until now has acted as a buffer absorbing heat, with more sunlight gets absorbed due to albedo changes and as with additional emissions, particularly methane, resulting from accelerating warming in the Arctic.

The numerous feedbacks that accelerate warming in the Arctic are pictured in the image below.

[ from: climateplan.blogspot.com/p/feedbacks.html ]
Furthermore, the necessary shift to clean energy will also remove the current masking effect of aerosols emitted when burning fuel. One study finds that a 35% – 80% cut in people's emission of aerosols and their precursors will result in about 1°C of additional global warming.

In the video below and the video further down below, Guy McPherson discusses Climate Change and Human Extinction.


This is further illustrated by the image below, showing how surface temperature rises are accelerating in the Arctic compared to global rises, with trendlines added including one for runaway global warming, from How many deaths could result from failure to act on climate change?
[ click on image to enlarge ]
The situation is dire and calls for comprehensive and effective action, as discussed at the Climate Plan blog.

Hat tip to Jim Kirkcaldy for pointing at the wildfire development at an early stage.